When we wrote in April about the iShares MSCI Italy ETF (NYSEARCA:EWI), we cautioned readers not to jump on the bearish trade too early. We suggested the pattern could continue drifting sideways/upward for several more months. Now we see price starting to test the area that could prompt a breakout from the decade-long converging range.
If EWI is tracing an Elliott wave triangle, as we believe, then the present rally should not challenge the high of 2014.
A downward thrust is more likely to begin from the area defined by resistance near 28.30, 30.30, and 30.80. The monthly chart below shows the structure of a possible ‘B’ wave triangle that we expect to resolve downward.
iShares MSCI Italy ETF (EWI) – Monthly Chart (Elliott Wave)
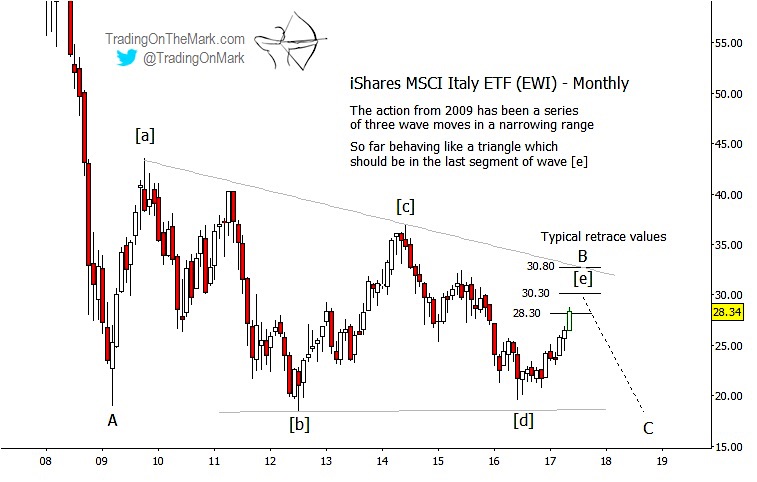
Since 2009, the chart of the Italy ETF (EWI) has offered a good example of how Elliott wave techniques can catch the turns that a contrarian trader might like to take. In particular, sentiment for Italian equity has been poor in recent years even as EWI and major European stock indices have rallied. Because the structure appears fairly clear for EWI, it might serve well to warn traders of the next downward turn in European equities generally.
The weekly chart allows us to examine the finer details of the pattern. Sub-wave [e] of the triangle should consist of a corrective structure moving up from the 2016 low. It may be possible to count that structure as being complete, with the final leg (c) expected to test and respond to the resistance zone.
However, an alternate view would see the rally from 2016 as merely the first leg (a) of the structure, with legs (b) and (c) yet to be printed. It is too early to be certain whether the iShares Italy ETF (EWI) is closing in on the final part of sub-wave [e] or can instead continue working through the pattern for another year. In either case, the dominant 77-week cycle suggests we should see a downward turn of medium or large magnitude soon.
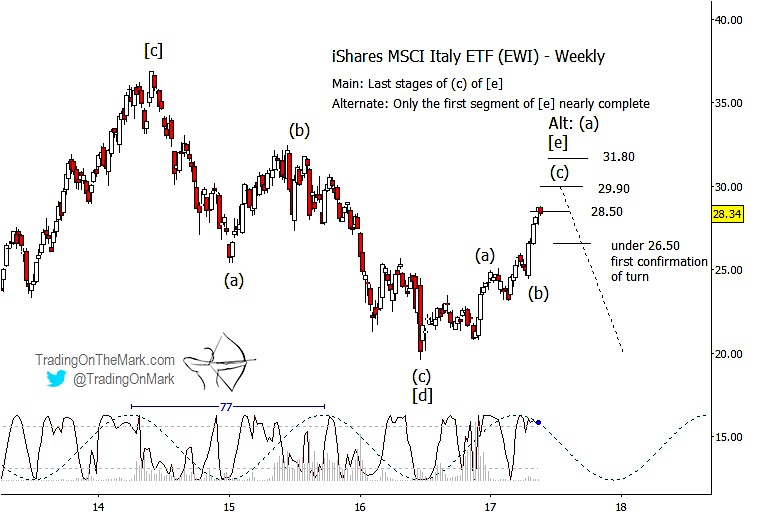
The specific resistance areas shown on the weekly chart were calculated based on Fibonacci ratios of leg (c) to leg (a) of the present rally as shown. They differ from the retracement targets shown on the monthly chart, but the overall resistance zone is similar.
A weekly close beneath the 26.50 area would help confirm a downward turn, which could develop either into a larger downward impulsive wave out of the triangle or a considerably smaller downward move as leg (b) of sub-wave [e] of the triangle.
Get timely alerts about market inflections by following us on Twitter and facebook!
Twitter: @TradingOnMark
No position in any of the mentioned securities at the time of publication. Any opinions expressed herein are solely those of the author, and do not in any way represent the views or opinions of any other person or entity.

 Testing Important Price Support")
: Cup (and Maybe Handle) Watch")

