One would think that with unemployment around 10%, you would be hard pressed to find positive economic data.
This economic cycle – if we can call it a cycle – is so unique that trying to follow a regular road map for recessions is certainly challenged.
There are many areas of the economy that have been truly crushed, including travel, retailers, hospitality and leisure. Yet there are other areas that are doing much better, or even thriving.
The housing industry should be under pressure with such high unemployment, but with all of us valuing our homes more given the extra time being spent in them, plus low interest rates, housing is doing well. This pandemic-induced recession has created winners and losers, in the economy and in the stock market.
While we continue to believe incremental economic gains will become increasingly challenging as the recovery continues, there is no denying the current pace has some momentum.
Chart 1 shows the New York Federal Reserve’s weekly economic activity index, which is composed of 10 weekly or daily indicators of economic activity including consumer, labor and production. It is still showing contraction in the economy but less than half the damage relative to the index back in early April.
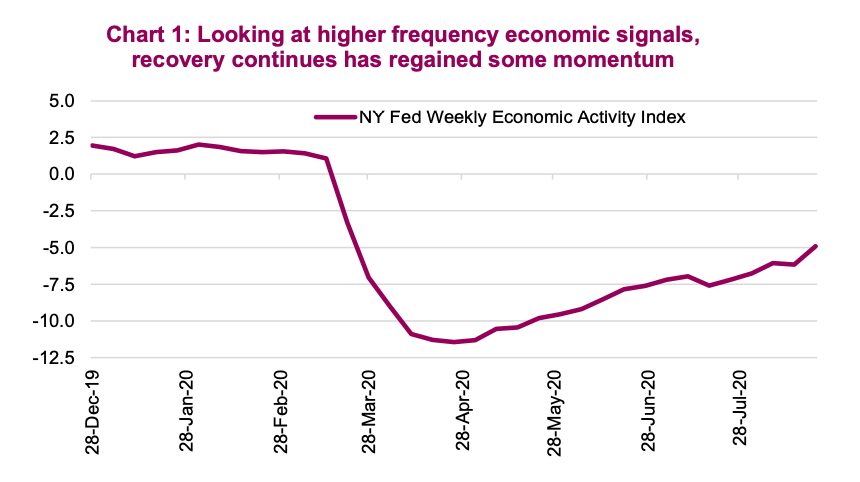
After a brief pause in July/early August, we have started to see renewed improvement in a number of higher-frequency indicators for economic activity. Travel remains dormant but restaurant bookings have picked up again. More traditional economic data points have also continued to improve, on average. They are not just rising, but rising more than most economists have forecast.
The Citigroup Economic Surprise index for the U.S. has been holding between +200 and +250 for more than a month now. While that is a meaningless number on its own, this index had never spent any time over +100 and most past peaks were very brief.
Industrial activity is also improving. It seems the shock to the economy was initially a demand shock as economies shut down. Now demand is returning, and the global economy is seeing supply constraints. Supply chains are now international and highly integrated. That means a stoppage or slowdown in one area can quickly flow through to other countries. (A personal anecdote – we waited two months for a new dishwasher!) There is evidence of some inventory re-stocking that should provide a continued positive lift for manufacturing in the coming months.
Market Cycle
We highlighted right off the bat during this recession that our Market Cycle framework would not work. The Market Cycle indicators were designed to indicate if an economy is slowing, leading to an increased likelihood of an economic contraction. Since this recession was self induced to fight a health crisis, the recession hit long before any of the economic data started to show signs of weakness. As circumstances are returning to normal, the efficacy of the framework has returned.
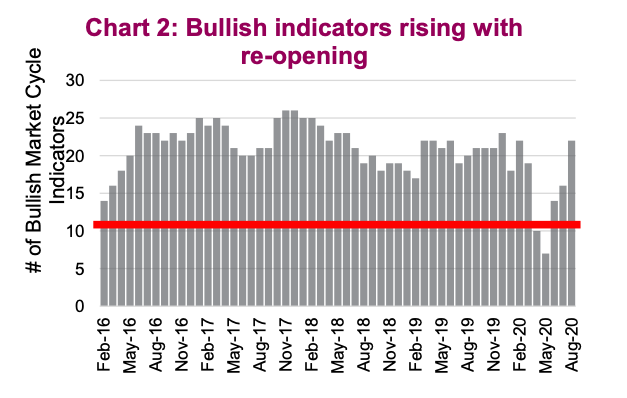
With a strong rebound off the bottom, the indicators are generally improving from low levels (Chart 2). Bullish indicators have improved to over 20, roughly back to where we were before the pandemic.
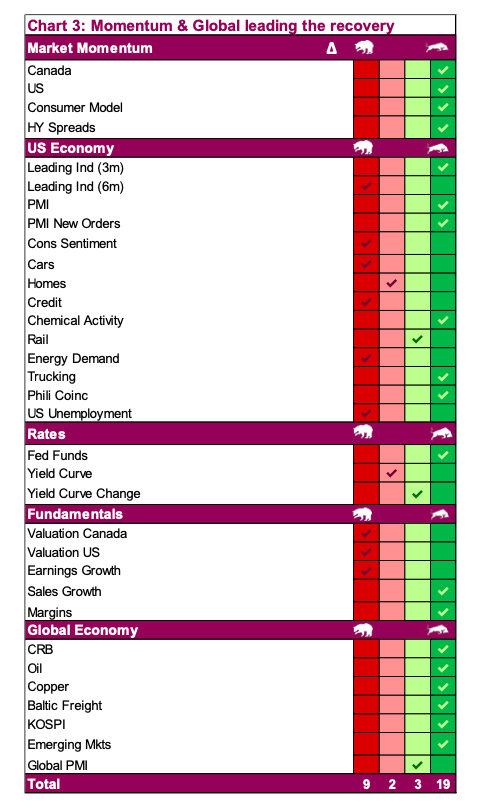
Chart 3 reveals where the strength is coming from and areas that remain weak. There is still some weakness in the U.S. economy and valuations remain stretched.
On the positive side, market momentum is strong and many of the global economic indicators have returned to bullish signals.
The future path of these indicators remains challenging as many contrast current levels of activity relative to a few months ago. As those comparables from a few months ago become more challenging, the true test lies ahead. At this point, the Market Cycle framework does remain optimistic.
All charts are sourced to Bloomberg L.P. and Richardson GMP unless otherwise stated.
Twitter: @ConnectedWealth
Any opinions expressed herein are solely those of the authors, and do not in any way represent the views or opinions of any other person or entity.

: Worrisome to Broader Market?")

