Materials stocks rallied today, ending the week and month on a positive note.
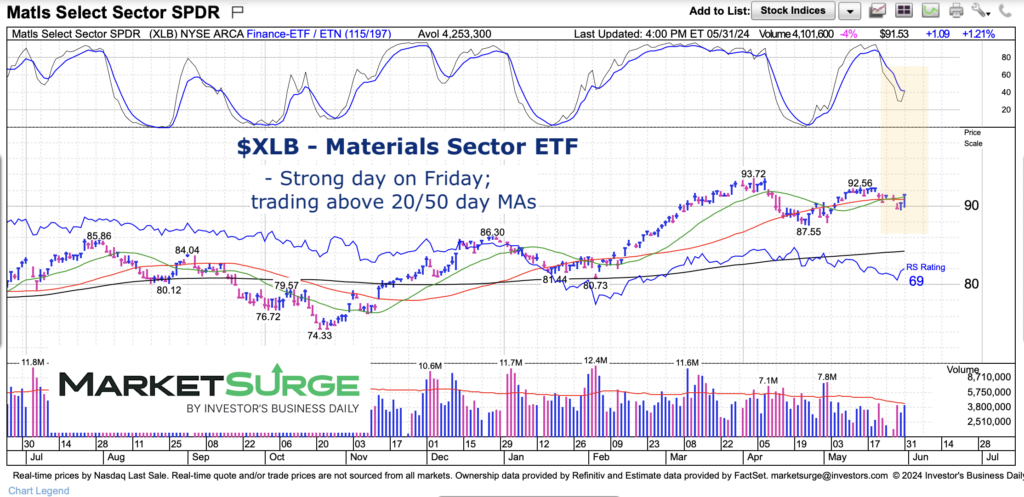
The rally pushed the Materials Sector ETF (XLB) up +1.2% for the day. XLB also settled above its 20- and 50-day moving averages.
So what’s next for XLB? And what should we be watching going forward.
Today’s chart highlights this and more as we try to navigate the path forward for the Materials Sector.
Note that the following MarketSurge charts are built with Investors Business Daily’s product suite.
I am an Investors Business Daily (IBD) partner and promote the use of their products. The entire platform offers a good mix of tools, education, and technical and fundamental data.
$XLB Materials Sector ETF Chart
Looking at the chart below, we can immediately see the bump higher from today. We can also see that momentum is trying to hook higher. This is a very interesting spot for XLB.
Will bulls participate in follow-through buying next week? If so, I would like to see the Materials Sector ETF make new highs (and hold above old highs). The stock market has been volatile recently so traders should proceed with caution.
Our only “edge” here is in our understanding that this is an inflection point and patience and discipline are key. Let the price action speak to you.
Twitter: @andrewnyquist
The author may have a position in mentioned securities at the time of publication. Any opinions expressed herein are solely those of the author, and do not in any way represent the views or opinions of any other person or entity.

: Worrisome to Broader Market?")

