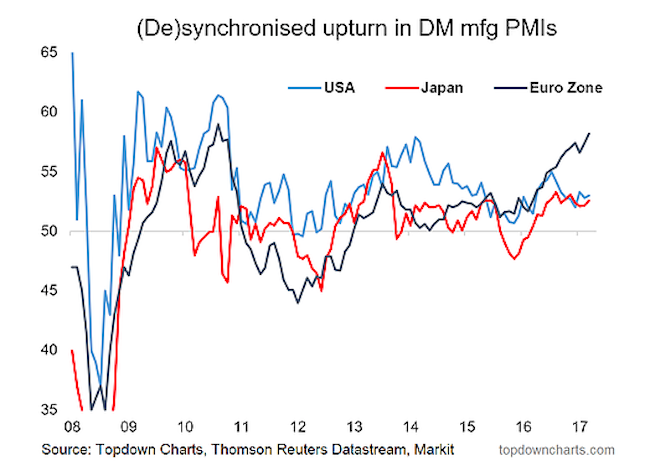
The September round of flash manufacturing PMIs saw our composite “global flash PMI” rising +0.4pts to 54.7 – the same level it got to in January before ranging as low as 53.9.
Looking at the breakdown, all 3 major components were up in September: Eurozone +0.8 to 58.2 USA +0.2 to 53.0 Japan +0.4 to 52.6. The global (developed markets) composite PMI has averaged 54.3 YTD, vs an average 51.9 in 2016. Despite the slight slowing in the first half of the year, it has been the strongest patch of growth since the post-crisis rebound, and that’s where it gets interesting…
What’s also worth noting is that across the major developed economies spare capacity is quickly running out. Solid global growth, particularly in the developed economies, paired with tightening capacity utilization in industry and the labor market is typically a recipe for inflation.
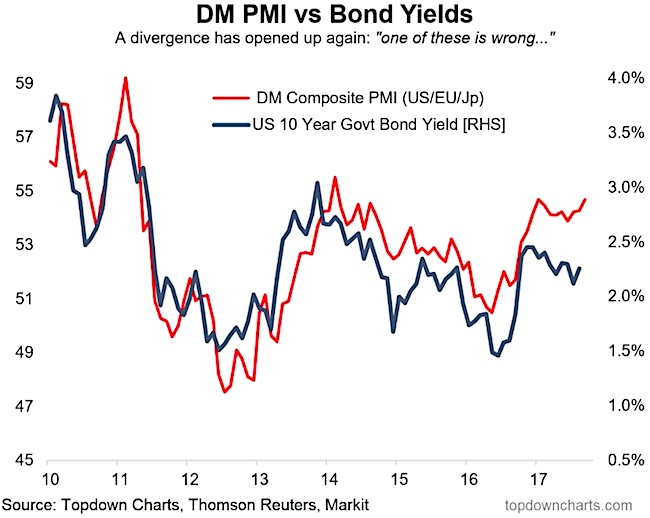
Stronger growth and higher inflation are typically the key ingredients for higher bond yields, and certainly make it harder to argue for ongoing QE: we’ve already seen the Fed announce passive QT – coming full circle in its program, while the ECB will be stepping away from QE soon, and the BoJ is grappling with the costs vs benefits of its relentless asset purchase program. So is the bond market “wrong” about the global economy? Time will tell.
The US 10-Year government bond yield has diverged to the downside against the DM composite PMI, whose September flash reading jumped to the highest level since January.
As noted previously, the strength in the Eurozone PMI puts the ECB in a difficult position regarding its QE program, and it will likely soon back away from its QE program. Thus the best days of QE globallly are likely behind us for now, and this will likely put upward pressure on bond yields.
Get more charts, and market insights over at Top Down Charts.
Twitter: @Callum_Thomas
Any opinions expressed herein are solely those of the author, and do not in any way represent the views or opinions of any other person or entity.

: Worrisome to Broader Market?")
