For select bank stocks and the BKX Bank Index, I guess you can say “here we go” or “lets get it on” (cue UFC John McCarthy) …
The BKX Bank Index completed the ABCD price pattern (counter rally) off the recent lows. The decline was a bit scary (see charts below) and the counter rally a bit relieving… But the question now is: Are we all good? Or is it about to get scary again for banks?
Well, I guess we will just have to wait and see. Below are some charts with analysis and thoughts.
Next stop: 66-68 or lower. Perhaps. Below are charts of the BKX Bank Index on an hourly and weekly and log scale.
A turn lower from here could be the start of another wave of selling. Pay attention. I wrote an article in March about the Bank Index sending caution.
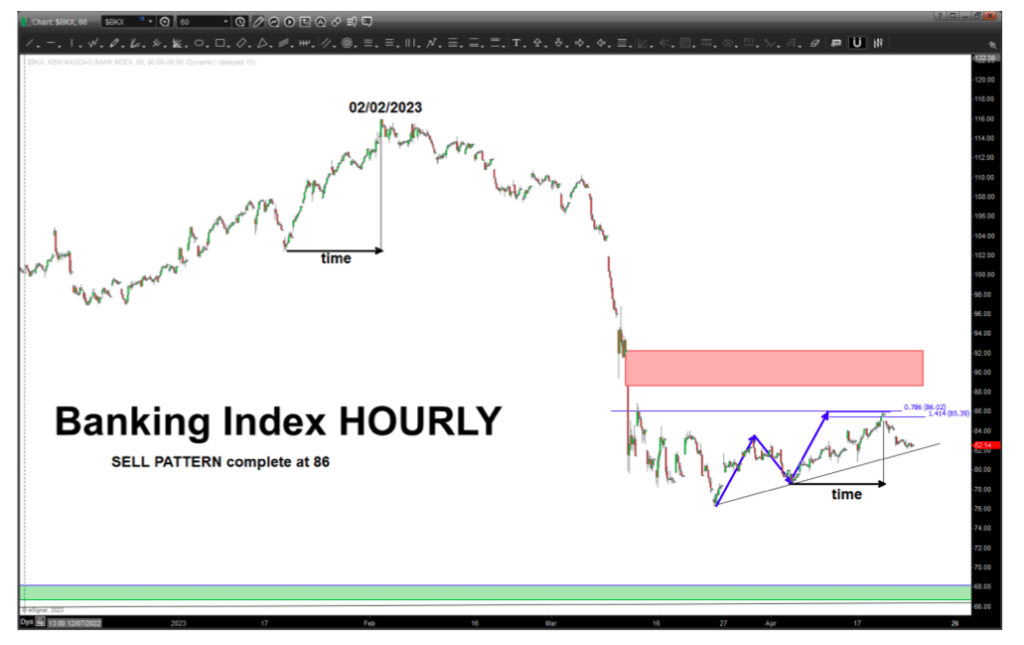
Here are some near-term targets:
BKX Bank Index hourly Chart
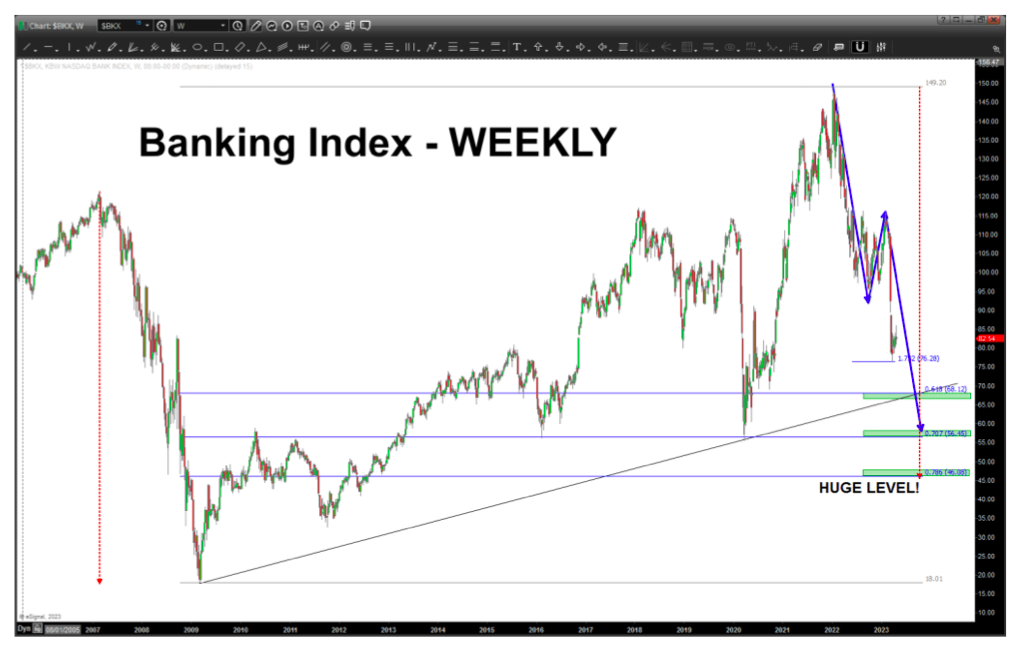
Here are some longer term targets…
BKX Bank Index weekly Chart
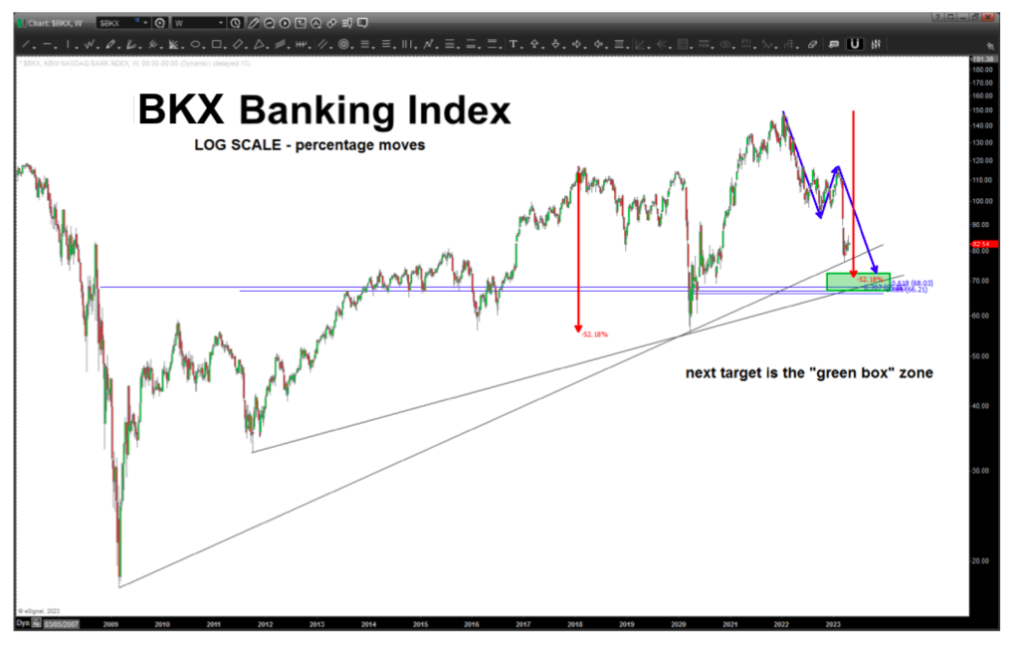
Here is the price analysis on a log scale chart:
BKX Bank Index log scale Chart
Twitter: @BartsCharts
Author does not have a position in mentioned securities at the time of publication. Any opinions expressed herein are solely those of the author, and do not in any way represent the views or opinions of any other person or entity.
: Cup (and Maybe Handle) Watch")
 Trading Near Top Of Price Range")
 Reaches Important Price Support")