Rising lumber prices have been a major source of inflation concerns. It’s one thing when the price of lumber doubles… and a whole other thing when it goes up 5-fold!
Yep, that’s right. Lumber prices have rocketed higher over the past 18 months, surging 5 times the COVID crash price low.
Something’s Gotta Give!
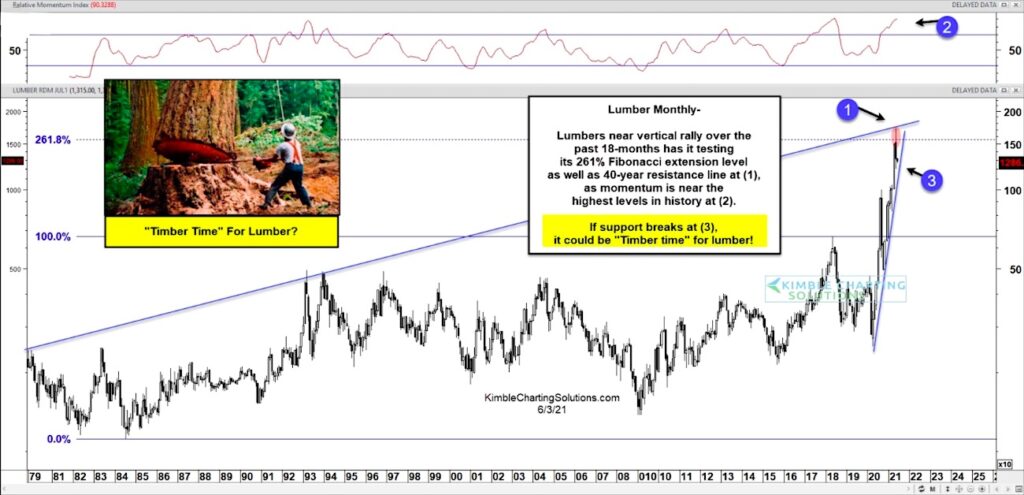
Today’s long-term “monthly” lumber chart highlights why there is a potential for a reversal / pullback in lumber prices over the coming weeks/months.
As you can see, the surge in lumber has price testing the 261% Fibonacci extension level, as well as the underside of the 40-year overhead rising resistance line at (1). Note as well that momentum is near its highest levels in history! Seems like a good area for a pause…
So how do we know if a pullback is underway? Watch that trend line! The steep up-trend line (3) offers short-term support. If it breaks, it could be “Timber Time” for lumber! Stay tuned!
Note that KimbleCharting is offering a 2 week Free trial to See It Market readers. Just send me an email to services@kimblechartingsolutions.com for details to get set up.
Twitter: @KimbleCharting
Any opinions expressed herein are solely those of the author, and do not in any way represent the views or opinions of any other person or entity.
")

 Testing Important Price Support")
")
