Rising prices have hit consumers hard and disrupted balance sheets in corporate America.
Even more interesting is that we have inflation while the US Dollar is strengthening! Crazy times.
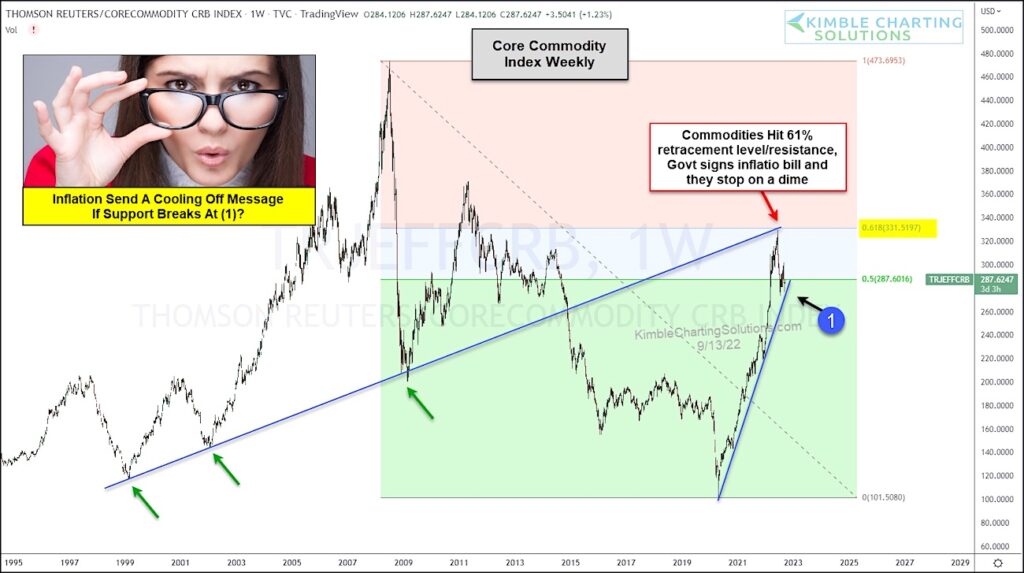
In any event, two of the biggest inputs are energy (gas) and agriculture (food). Both of these (and more) play a hand in the overall CRB Core Commodity Index. And today, we look at a long-term “weekly” chart.
As you can see, commodities rallied sharply over the past 2 years reaching the 61.8% Fibonacci retracement level (resistance). It was at this point that CRB peaked… and it also coincided with the government inflation bill.
If support fails to hold at (1), odds increase that commodities will actually start cooling off! Investors (and consumers) sure hope so. Stay tuned!!
$CRB Thomson Reuters Core Commodity Index “weekly” Chart
Note that KimbleCharting is offering a 2 week Free trial to See It Market readers. Just send me an email to services@kimblechartingsolutions.com for details to get set up.
Twitter: @KimbleCharting
Any opinions expressed herein are solely those of the author, and do not in any way represent the views or opinions of any other person or entity.

: Worrisome to Broader Market?")
