The global equities market has been in a tailspin this year.
But could it get worse yet?
Today we look at a very important piece of the global equities complex: China.
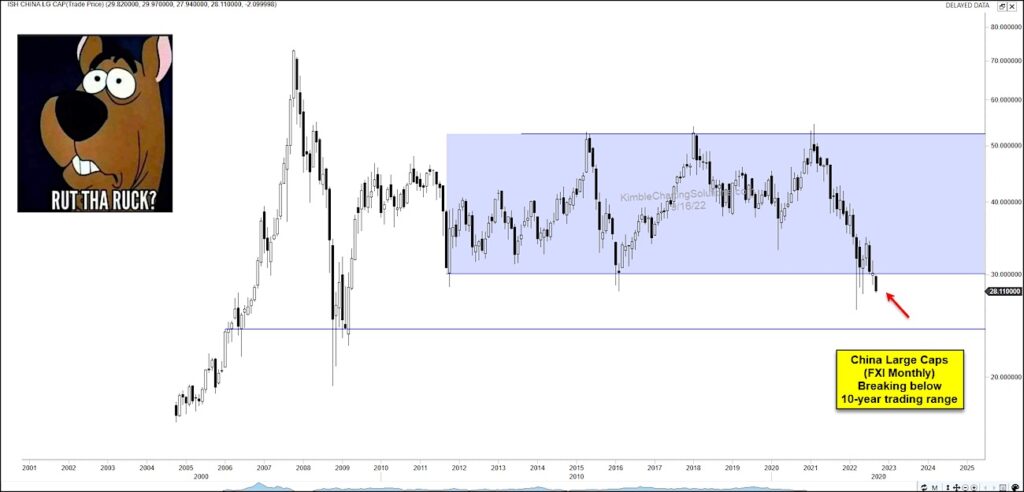
Today’s “monthly” chart of the China large cap ETF $FXI highlights the risk that China may be breaking below a 10-year price range (blue shade area). It is already trading below it… but we’ll have to watch the monthly close. Further selling would indicate a retest of the 2009 lows is underway.
This may explain the recent bubble up in volatility. Will there be big trouble for big caps in China? Stay tuned!
$FXI China ETF “monthly” Chart
Note that KimbleCharting is offering a 2 week Free trial to See It Market readers. Just send me an email to services@kimblechartingsolutions.com for details to get set up.
Twitter: @KimbleCharting
Any opinions expressed herein are solely those of the author, and do not in any way represent the views or opinions of any other person or entity.
")


")
