Chinese stocks have been in a funk this year, testing the patience of many investors in that equities space.
The selloff took shape at the beginning of the year and has continued through this fall. Is there an end in site? Perhaps not quite yet…
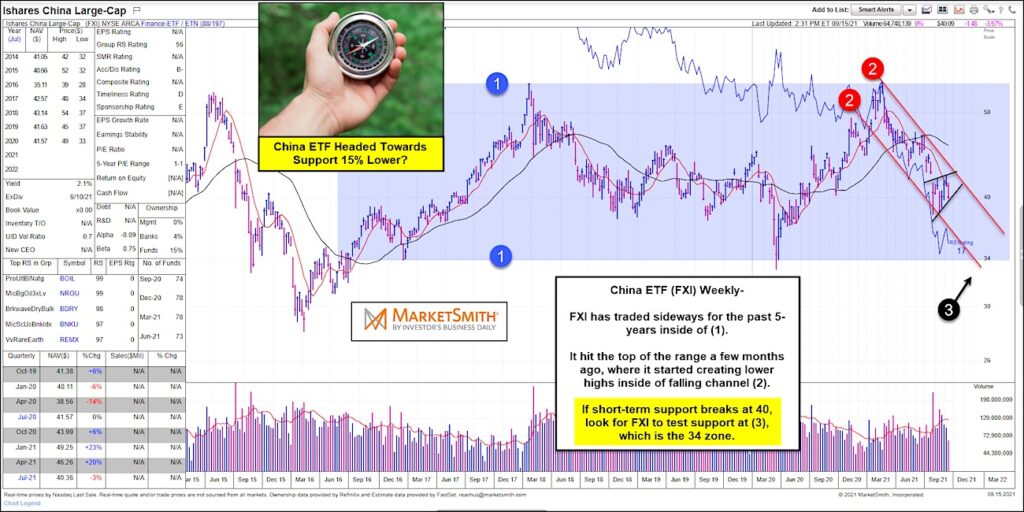
Today we look at a “weekly” chart of the iShares China Large Cap ETF (FXI) to better understand what’s next for large cap Chinese stocks.
As you can see, FXI has traded in a wide sideways channel for the past 5 years marked by each (1). It hit the top of the range several months ago where it started creating lower highs in side of a falling channel marked by each (2).
A bearish wedge pattern has formed and offers support at $40. But if FXI breaks down through that support then it is likely headed to the bottom of the channel around $34 (or 15% lower!)
This would mark another big drop. Stay tuned!
Note that KimbleCharting is offering a 2 week Free trial to See It Market readers. Just send me an email to services@kimblechartingsolutions.com for details to get set up.
Twitter: @KimbleCharting
Any opinions expressed herein are solely those of the author, and do not in any way represent the views or opinions of any other person or entity.

: Showing Some Signs of Emerging Strength")
