In this week’s market video, we analyze Shiller’s PE, or the Cyclically Adjusted Price Earnings Ratio (CAPE).
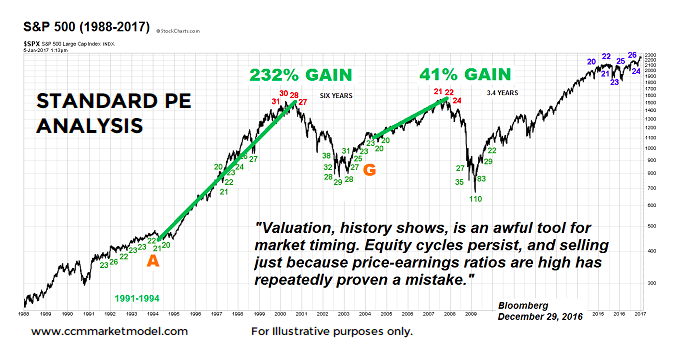
Stock valuation measures are generally poor indicators for market timing. Just take a look at a chart of the standard Price to Earnings ratio.
Standard Price to Earnings (PE) Ratio Chart
So how is CAPE different from the Standard PE valuation? And what is CAPE saying right now?
Below is an excerpt from my article on CAPE:
Given the level of detail required to perform an analysis of the Shiller PE, it is best accomplished in video form. Like the standard PE graph above, the video below covers numerous examples of stock market set-ups in the context of the CAPE ratio. Specifically, the video addresses the following questions:
-
What type of environment are we facing in January 2018?
-
If we study similar historical environments, was the Shiller PE helpful?
-
Does the Shiller PE negate the recent long-term bullish breakouts in stocks?
-
Is stock market upside limited by Shiller readings?
After you click play, use the button in the lower-right corner of the video player to view in full-screen mode. Hit Esc to exit full-screen mode.
Twitter: @CiovaccoCapital
The author or his clients may hold positions in mentioned securities at the time of publication. Any opinions expressed herein are solely those of the author, and do not in any way represent the views or opinions of any other person or entity.


: Showing Some Signs of Emerging Strength")
