The SNR (signal to noise ratio) is a measurement often used in science and engineering that compares the desired signal with background noise.
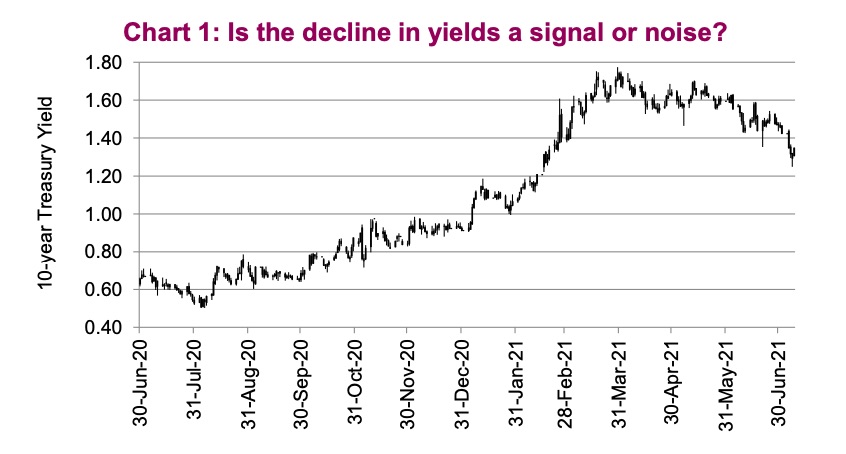
This thought structure could be applied to the treasury bond market of late – is the fall in bond yields signaling that inflation and economic growth are set to decelerate? Or is it more noise?
The drop in yields has surprised most market participants, including us. While a consolidation after the 10-year yield rose from 60bps to 175bps was certainly warranted and largely expected, few saw yields giving back about 1⁄2 of their gains.
Making things even more uncertain, and interesting, is a lack of convincing arguments for the pullback in yields, with three arguments being most prevalent:
1) Some have opined it is the Fed’s nudge that they would raise rates a bit faster/sooner than previously expected, to counter inflationary trends. Slower inflation would imply lower economic growth and lower yields. There are several logic hoops to jump through to reach this conclusion, any of which could be misread. Normally, a slightly more hawkish Fed would imply higher yields, not lower.
2) There is also the argument that the current inflation pulse is ending and will come crashing down as demand normalizes and supply bottlenecks are solved. This is the ‘all the current inflation is transitory’ argument. We are about to enter the backside of the inflation spike, after which high debt and demographics will resume ruling the inflationary roost, pushing yields back down. We agree the inflationary data is about to roll over; the big question is whether it comes back down to previously low levels or remains elevated to a degree. Yields are pricing in the former, we believe the latter.
3) And the final argument is that the re-opening economic boost is about to fade. Possibly, but the data continues to support some pretty strong economic growth in the coming months and quarters, with continued pent up demand to spend and do things.
Bond yields are signalling that one of these scenarios is most likely, but we believe it is more noise than signal. Nothing in the market moves in a straight line and after big moves often come periods of consolidation. Yes, this consolidation appears to be of greater magnitude, but we believe it is a consolidation amplified by three factors.
The first is that bond traders take their vacations very seriously, and volumes are often lighter in the summer months. Less liquidity often implies larger price moves.
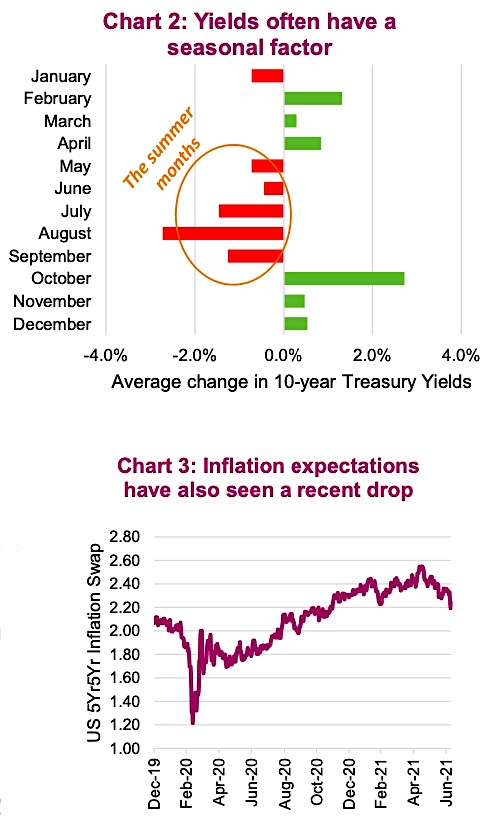
The second factor is also seasonality. Based on data since 1990, bond yields often fall the most in the summer months on average (Chart 2). While there is much variation in seasonal data, seasonality has likely contributed to the recent decline in yields. And finally there are speculators. During the past few weeks there has been a decent amount of short covering in the futures and options market for Treasuries, likely contributing to the upward move in bond prices (aka decline in yields) of late.
The recent fall in bond yields has largely coincided with inflation expectations coming off a bit (Chart 3). While some of the transitory inflation data is starting to soften, it is worth noting wage pressures have picked up. Lots of openings, less participation and strong economic growth / recovery all bode well for wages. We are also heading into earnings season, and if the trend of past quarters continues, cost inflation will increasingly be a topic on conference calls. Inflation is often more of a mindset than an economic data point. The more people talk about it, the greater its impact.
Re-up
We think this is a consolidation period for yields, albeit a sizeable one. Along those lines, the reflation trade that came under pressure as yields declined during the past month, is likely still intact. This pullback has also created some more interesting price points in many cyclical & value names, from materials to financials. We believe this will prove to be a temporary opportunity.
Source: Charts are sourced to Bloomberg L.P. and Richardson Wealth unless otherwise noted.
Twitter: @ConnectedWealth
Any opinions expressed herein are solely those of the authors, and do not in any way represent the views or opinions of any other person or entity.

: Showing Some Signs of Emerging Strength")
