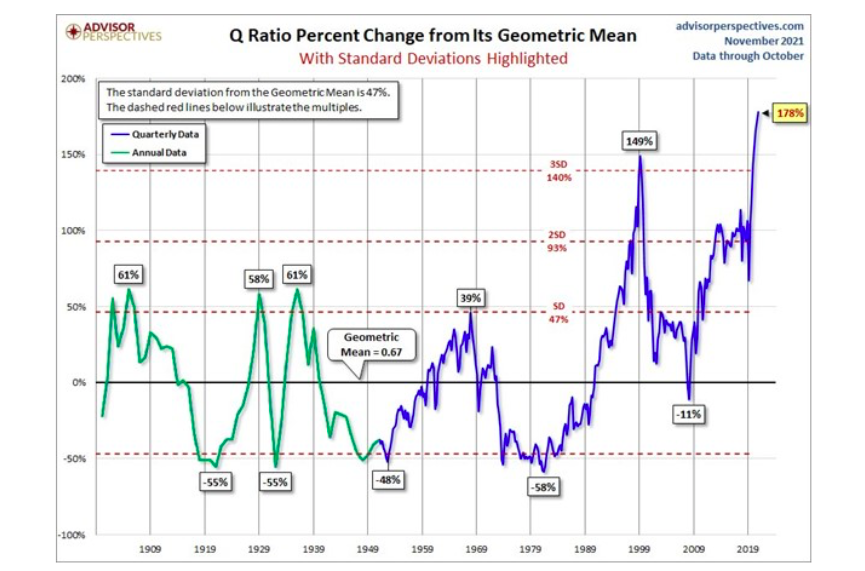
The Q-ratio takes the S&P 500 market cap and divides it by the aggregate replacement costs of the assets held by the companies in the index.
It effectively quantifies how much an investor is paying for the underlying corporate assets. As shown below, courtesy of Advisor Perspectives, the ratio is now over 3.5 standard deviations above its norm. It is also higher than it was in 1999 and multiples of any other prior peak.
Compared to What?
Conservatively speaking, current valuations are on par or greater than those in 1999 and any other period. Such a statement is statistically factual, but it ignores the economic environments of both periods. For instance, if you think the economy and corporate earnings will grow at double-digit rates for years, we can make the case valuations are fair today.
The table below compares economic environments from both periods.
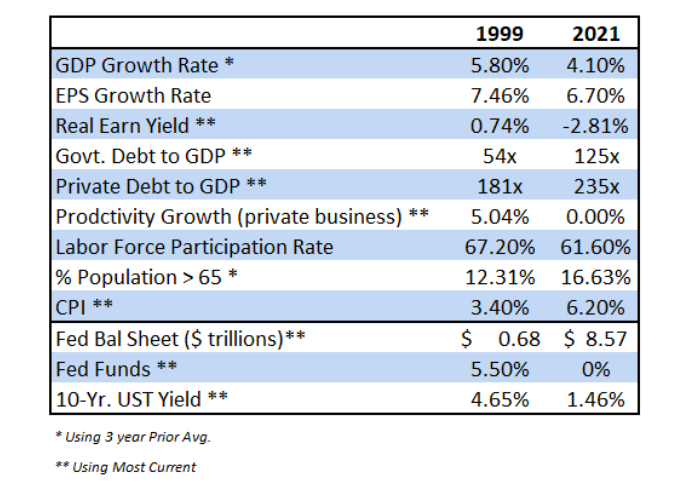
Economic and earnings growth rates today are weaker than 20 years ago. Further, debt levels, measured as a ratio to GDP, are much higher today. Productivity growth and demographics, two significant factors determining economic growth, are weighing on economic growth today. In the 90s, they were strong economic tailwinds.
The last three indicators show the amount of monetary stimulus via low-interest rates, and the Fed’s enlarged balance sheet is much more accommodative than in 1999.
Fundamentals and the economic/earnings outlook are weaker today than in 1999. As a result, investors were better off paying higher valuations in 1999 than today.
However, the Fed is, directly and indirectly, bolstering asset prices and, therefore, valuations via their excessive actions. Low-interest rates promote the use of leverage and encourage buybacks which fuel stock prices. Additionally, investors shun low-yielding bonds to chase stocks to pick up needed returns. For more, please read The Fed is Juicing Stocks.
The Fed is the Fundamentals
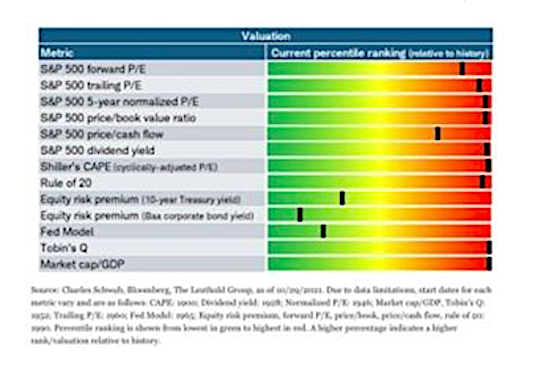
The bottom line is investors are paying more and getting less compared to 1999. The graph below shows numerous measures of valuations are at extremes except three. Those three in green shading use comparisons of stock prices to interest rates. They are “fairly valued.”
Whether they know it or not, investors are betting the Fed continues to levitate the market. Can stocks remain at extremely lofty valuations while lacking fundamental backing if the Fed continues to reduce QE purchases and ultimately raises interest rates?
Essentially the real gamble investors are taking is that inflation will be transitory. If high inflation is persistent and not transitory, the Fed will find it increasingly challenging to continue current policy.
Without the Fed’s enormous liquidity, valuation gravity will reassert itself.
Statistics Warn of 2650
The graph below shows the strong correlation between CAPE valuations and future 20-year returns. At current levels, highlighted in yellow, we should expect annualized returns ranging from 2-4% for the next 20 years.
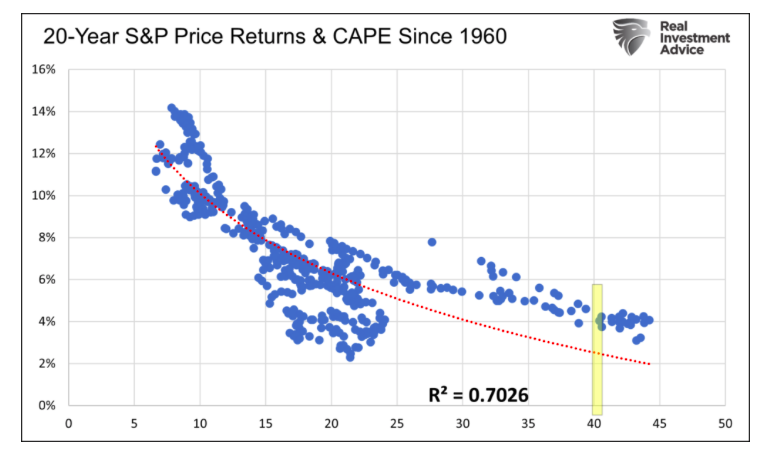
You may be thinking 2-4% doesn’t sound too bad considering how high valuations are. The problem, however, with such a long-range forecast is there may be periods with negative growth and others with double-digit growth within the twenty years.
While the regression allows us to form 20-year expectations, it also gives us the ability to forecast shorter periods.
Eighteen years ago, in October 2003, the S&P stood at 1019.50. Based on the regression above, investors could expect 4.90% annualized returns at that time. At such a growth rate, the S&P would rise to 2655 in October 2023. Currently, the S&P 500 is around 4700. Assuming the regression holds and history has favorable odds of that occurring, we should expect the S&P 500 to fall to 2650 in the next two years. A 43% decline is harsh, but it will only leave the index at fair value based on the last 40 years of CAPE levels. Quite often, markets revert below their means.
Before you dismiss our statistical analysis, let’s look back to 1999.
Prince wrote “1999” in 1982. When he wrote it, the S&P was at 111. Using the same math, investors could have expected 12% annualized returns, putting the S&P 500 at 1068 on New Year’s Eve 1999. The S&P, at the end of 1999, was 1450, offering investors a two-year expected return of -26%. Statistics delivered right on cue, and just two years later, the S&P hit 1068. The index ultimately fell to the low 800s before the stock market crash ended.
Summary
Every era of speculation brings forth a crop of theories designed to justify the speculation, and the speculative slogans are easily seized upon. The term “new era” was the slogan for the 1927-1929 period. We were in a new era in which old economic laws were suspended.” -Dr. Benjamin Anderson – Economics and the Public Welfare
Investors are making a big bet on the Fed and a “new era.”
On the eve of the stock market crash in 1929, Irving Fisher erroneously declared that stocks hit “what looks like a permanently high plateau.” Fisher could not have been more wrong. Same with investors in the “new era” of the internet of the late 90s.
Do you have faith the “new era” of Fed-managed markets can levitate stocks well above historical norms and prevent a stock market crash? Or will this “new era” resolve itself like prior “new eras” with a stock market crash?
Twitter: @michaellebowitz
The author or his firm may have positions in mentioned securities at the time of publication. Any opinions expressed herein are solely those of the author, and do not in any way represent the views or opinions of any other person or entity.


 Ready To Break Out?")


