S&P 500 Index (SPX) Forms A Hammer
Last Wednesday, the stock market made a short-term bottom, declining sharply before reversing course. Crude Oil prices also put in multi-year lows and the yield on the US 10 Year Treasury Yield fell below the 2% for much of the session (here’s why that’s important to watch). This was enough to create a panic in the Financial sector and broader market.
But short-term market capitulation opened the door for stocks to begin to recover from the day’s rout. And, as the recovery wore on into Thursday and Friday, the price action formed a precarious hammer at the lower trend channel support line. You can see the hammer candlestick on the weekly chart below. A sign of investors bottom fishing perhaps?
S&P 500 Index – Weekly Chart
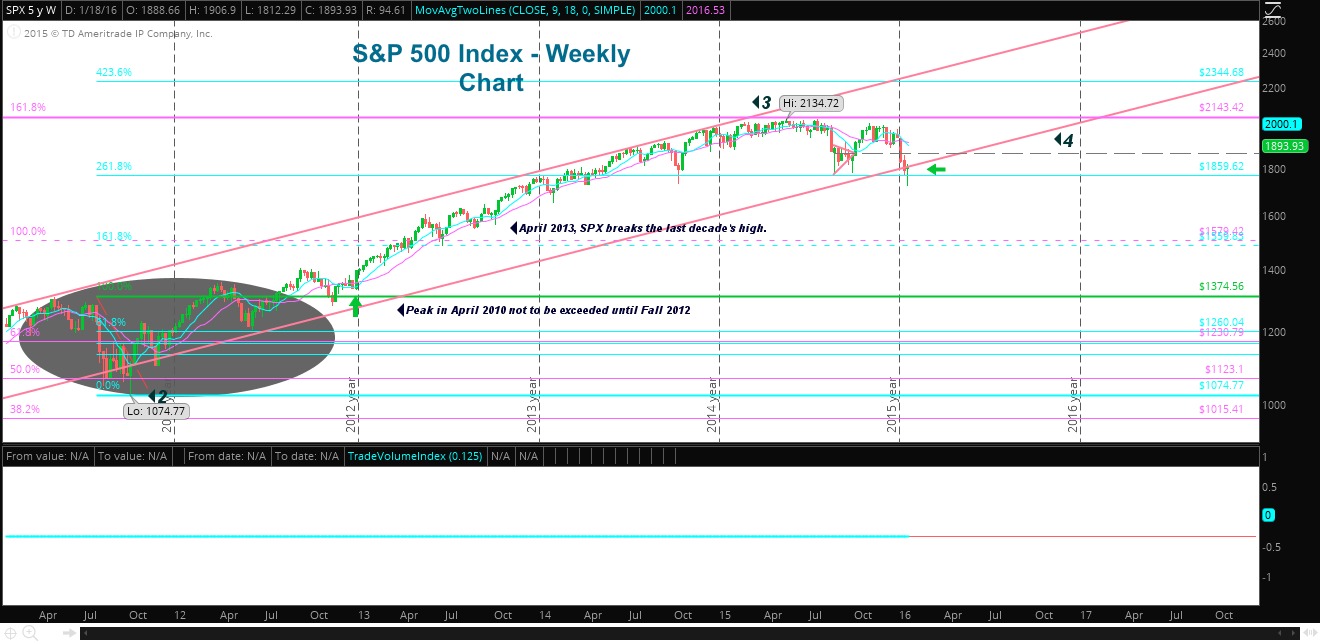
created with Think or Swim
Bottom Fishing in Basic Materials (XLB), Financials (XLF), and Consumer Goods (XLY & XLP)
So what were investors buying? Seems Basic Materials, Financials, and Consumer Goods were the first to see money flowing back into stocks in these sectors following the Wednesday sell-off.
Basic Materials have, unsurprisingly, taken a beating over the slowdown in China. A sign that money may be flowing back into the sector could indicate that the worst of our fears over China’s impact to demand is tempered for now.
However, a scan of markets shows there is very little to be found in terms of bases that trend traders would look for. Instead, we find more of the price actions indicative with bottom testing… investors are putting a toe in the water.
Ford (F) – Another Economic Bellwether
As you can see in the chart below, Ford (F) sits at the low end of the trend channel. But, like the stock market, it too received a boost while putting in a weekly hammer candlestick last week.
So there are bottom testers here in Ford too. Ford is expected to report earnings next week. In October, strong U.S. sales did not mute disappointment over poor performance in emerging markets. And, as you can seed in the weekly chart below, Ford failed to breakout of the downward trend channel it has traded in since the fall of 2013.
Three months later and heading into the next earnings session, Ford is trading at the lower end of the dealer channel. At the low end of this channel, I would expect value investors to step in and support the stock, and (as noted) in previous sessions they have not disappointed. The fact that Ford has been supported at this lower end tells us that, for now, there is some level of confidence both for Ford and the market in general.
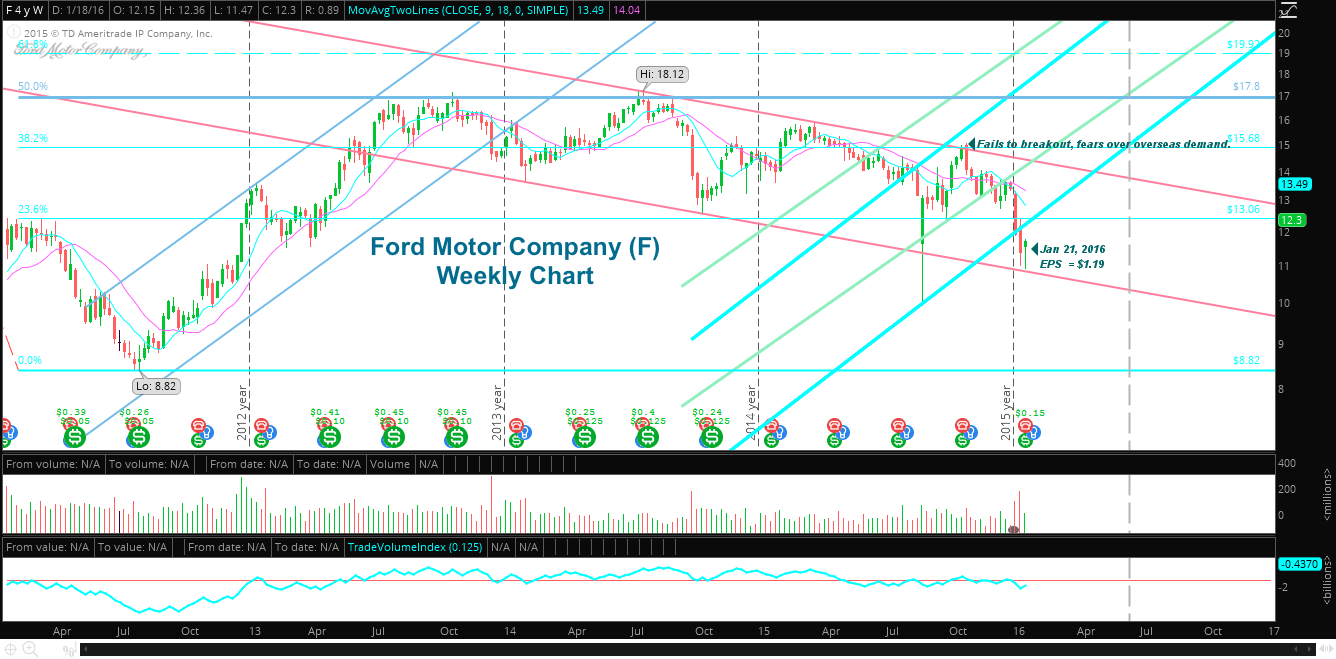 created with Think or Swim
Lesson from 2010-2012
I’d like to share one lesson from the market turmoil of 2010 thru 2012 (see dark oval in the SPX chart above). When Chinese markets last peaked and the financial crisis in the Euro zone heated up, it took several weeks or months for the market and stocks to digest all the bad news and start new trends. That may be in store yet again.
Moreover, solid price bases take weeks or months to form after a bottom, as Willie Delwiche shared last week. The only thing to do is to follow the money flow and identify the sectors that will be favored when the next trend emerges.
Thank you for reading.
Twitter: @rinehartmaria
No position in any of the mentioned securities at the time of publication. Any opinions expressed herein are solely those of the author, and do not in any way represent the views or opinions of any other person or entity.

: Worrisome to Broader Market?")
