August may be known as the month of Volatility, but September is regarded as the the worst month for stocks. Simply put, August may have the biggest, unexpected volatility spikes from a place of complacency, but September has the largest draw-downs in equities, historically.
So what’s at stake, or should I say, at risk coming up this month? Here’s the list:
- Interest rate decisions from the FED, BOJ and ECB
- North Korea nuclear threats and Trump’s potential retaliation
- China trade war (ramping up with No Korea)
- Debt Ceiling (potential S&P downgrade if government shuts down)
- Houston bail-out and preliminary impact on GDP, home sales, employment, debt, energy sector
- Russia-gate and broader Mueller investigations
- German Federal Elections
- China’s new Congress
- Sell Rosh Hashanah, Buy Yum Kipper
- Isn’t that enough? Oh wait, we have Hurricane Irma!
In times of central bank distrust, Gold historically catches a bid. Add to that we have seasonal tendencies for gold strength in addition to geopolitical and military risk. Is it a wonder Gold is up 15% this year to SPY’s 10%? Smart money is hedging with SPX puts like never before, while buying Gold and selling the US Dollar. Gold/Silver miners have actually led Gold which is even more of a ‘Tell’ Gold is in favor again. But all of this is fragile if the US Dollar spikes–either from an oversold condition or from potential trade war with China.
Still it pays to be long Gold as it is even doing better than bonds (all bond categories) for the first time in six years, and gold has broken out and outperformed stocks for the first time since 2011. TIPS (Treasury inflation protected securities) is down 13% relative to gold which shows inflation is not currently considered a risk but global stability is as seen when investors favor gold assets over the safety of bonds. Even TLT, which often trades in tandem with gold, is up only half as much. But most telling of all: Gold miners rose twice as much as gold last week with a very impressive 3:1 margin since the start of 2016. That’s stealth ‘risk-off’ positioning.
One very likely reason gold has outperformed bonds is the fear rates might rise, by design or default from tapering, putting pressure on bond holders. Gold may be seen as a safer bet to bonds and overvalued equities. Historically, it is a good sign for Gold when Miners lead Gold and Gold leads SPY.
Debt Ceiling, Rate Hikes and Gold
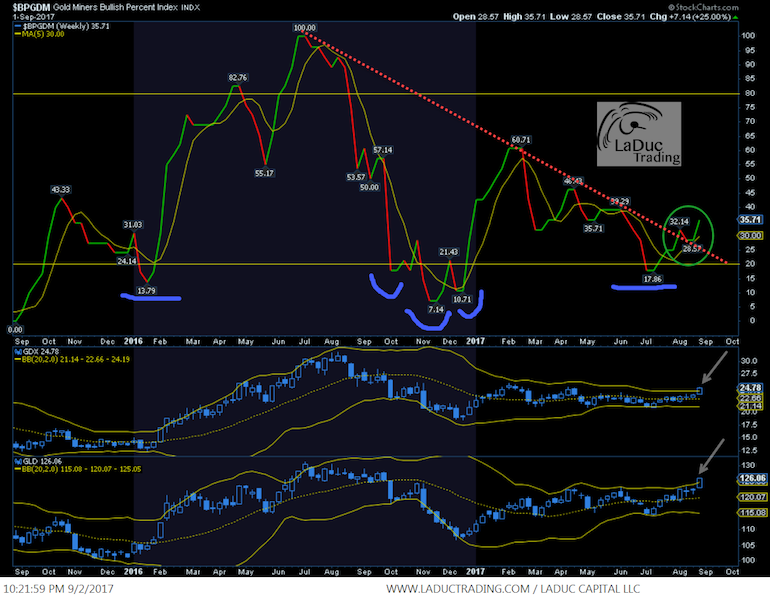
You would think that Gold would be a safe bet leading into a Debt Ceiling drama like may happen this month. However, the last time Congress fought over the Debt Ceiling Dilemma (August 2011), US credit rating was downgraded, SPY dropped 19%, US Dollar spiked and Gold topped within a few weeks (still 32% from all time highs). In fairness, it wasn’t the Fitch downgrade that spooked Gold but the response by the FED to regain confidence in the market by enacting ’round 2′ of its Quantitative Easing (QE), but with a twist. Operation Twist, as it was called, attempted to add liquidity but without printing more money and expanding the Fed’s balance sheet in hopes of avoiding inflationary pressures. At the same time, Europe was in the throes of its Debt Crisis prompting Mario Draghi’s famous “Whatever it takes” speech. With central bank confidence restored, the result was good for stock market appreciation but not gold’s market.
That is, until December 2015 when the Fed hiked rates for the first time in a decade and Gold bottomed. Look again at the chart in December 2016 and most recently in June 2017. Gold likes rate hikes. Is Gold’s advance this year a Tell to a surprise rate hike/FED tightening cycle? And/or potentially the ECB unwinding come December/March? Or just lack of confidence in Central Banks? The market of stocks may not see these events as positive but Gold and miners seem to! And as I wrote about in Timing The Stock Market Top:
I’ve been looking at a lot of macro charts and three recurring themes appear to signal a market top: 1. Full employment (check) that starts to reverse (not yet). Followed by an oil spike (or insert ‘other commodity’). 3. Fed-induced recession (higher rates which lead to economic contraction). Market leadership in Tech losing momentum is not enough. When growth tops out, it can lead to months of under-performance and volatility between growth and value plays, but we need the Credit Market to Lead the Equity Market for the market to truly roll over. There are signs of strain (flat yield curve as example), no question, but not of breaking.
So what am I looking for? Well, as you know, I like to follow money flow and money rotates around awhile before real money buyers step away. I’m watching as money rotates from tech, consumer spending stocks and industrial stocks into maybe-just-maybe inflation-hedged commodities. Why? A surge in inflation proxies might actually be the signal that the market is in the late stages of a blow-off top. So while we are all anxiously awaiting signs of inflation, be careful what you ask for, you might just get it, and with that…a market top.
With that, Gold may be the new VIX and TLT!
Friendly Sidebar: It’s easy to subscribe to my Free Fishing Stories/Blog for more insights like these. You are also invited to Come Fish With Me on any trading day! Thanks for reading and Happy Trading.
Twitter: @SamanthaLaDuc
Any opinions expressed herein are solely those of the author, and do not in any way represent the views or opinions of any other person or entity.


