Seasonal Patterns are neutral. September’s history as being a tough month for stocks has been widely reported (and that could mitigate some of the normal annual effects). Of more concern is the seasonal effect caused by the Presidential election. There is a sharp divergence in the pattern between years when the incumbent party wins and years when the incumbent party loses. Donald Trump’s recent bounce in the polls represents a challenge to the incumbent party. Further tightening could be a headwind for stocks as we move toward the election. The good news is that regardless of which party wins the election, stocks historically make a low early in the fourth quarter and move towards year-end with a tailwind.
Market Breadth
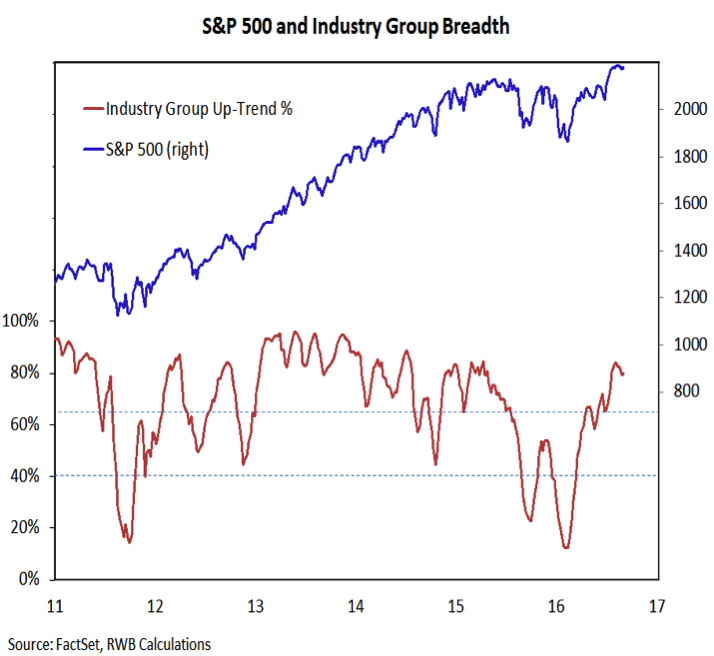
Breadth remains bullish. Supporting the view that the February low was on par with the October 2011 low has been the performance of the broad market, especially as measured by our industry group trend indicator. After bottoming earlier this year with only 12% of groups in up-trends (the 2011 low was 14%), this indicator saw considerable strength as the rally attracted broad support. At its recent peak, this indicator showed nearly 85% of industry groups in up-trends, consistent with the peak that accompanied the initial rally off of the 2011 lows. Also noteworthy is the diffence in breadth between this year and last year. Rallies in 2015 were accompanied by lower highs across various breadth indicators, while rallies in 2016 have been accompanied by higher highs.
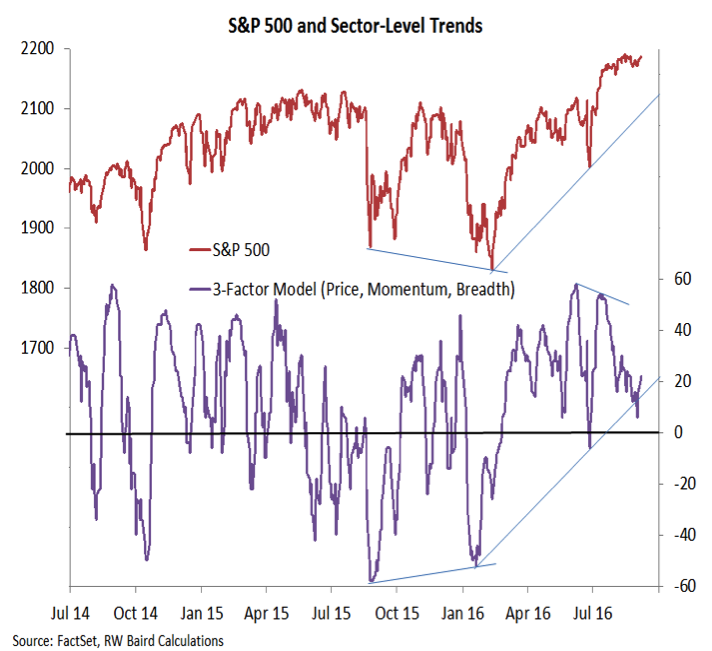
While strong breadth trends offer a constructive outlook, they do not prevent near-term pullbacks/corrections from emerging. A shorter-term look at breadth (in this case, sector-level trends) suggests that the rally off of the February lows has lost a step. While the S&P 500 has muddled around in a narrow trading range for the past two months, sector-level trends have deteriorated. In the same way, while advance/decline lines have moved higher, the number of stocks actually making new 52-week highs has contracted. Improved readings from shorter-term breadth indicators would suggest that the rally has corrected (either through time or through price), but so far that evidence has been lacking.
Where to look for opportunity:
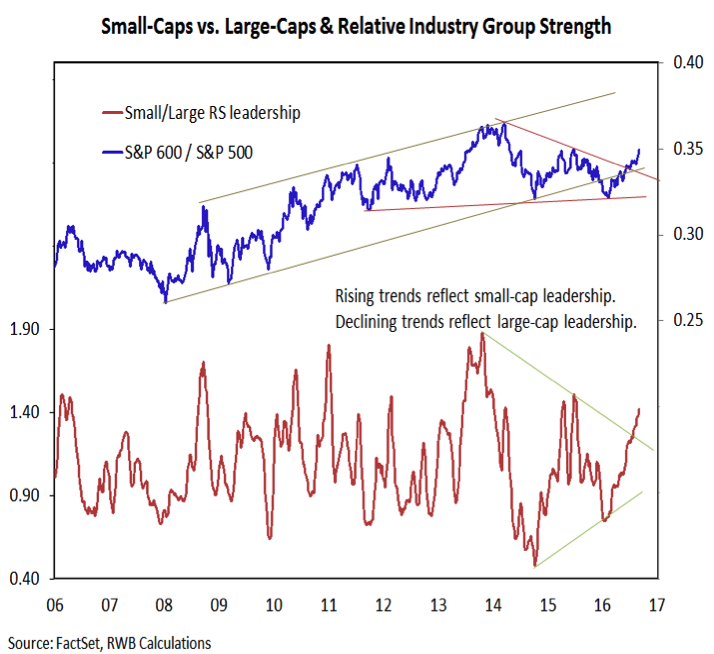
While large-caps have struggled to make any headway over the past two months, small-caps have continued to gain relative strength. Resurgence in small-cap leadership comes not only from a price perspective, but can also be seen in industry group leadership trends. Small-caps industry groups are moving higher in the rankings while large-cap groups are falling. This suggests there is broad support behind the strength being seen in the S&P 600 (small-caps) versus the S&P 500 (large-caps). Small-caps have rallied to, and through, resistance, ending a two-year period of large-cap leadership.
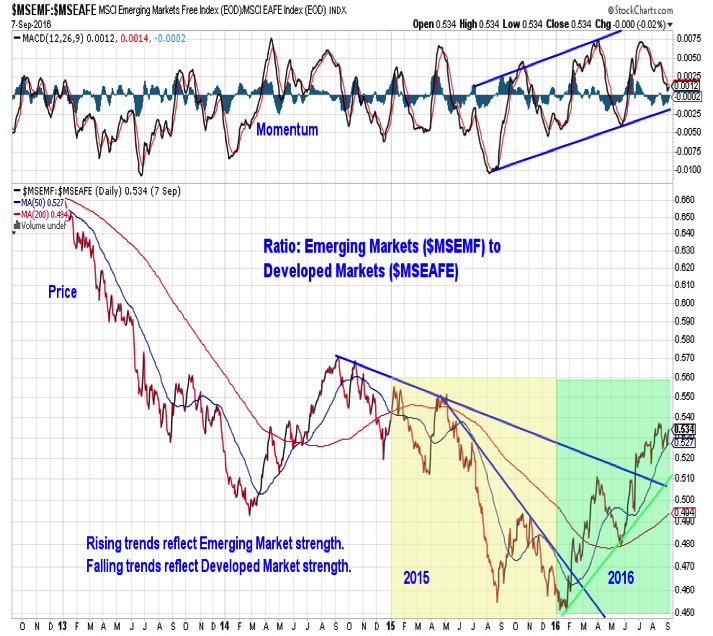
While small-caps are providing domestic leadership, emerging markets are providing leadership abroad. Similar to the case with small-caps, Emerging Market relative strength in 2016 is in sharp contrast to the relative weakness seen in 2015. The trend favoring Developed Market leadership has been broken and emerging markets have made a series of higher highs and higher lows.
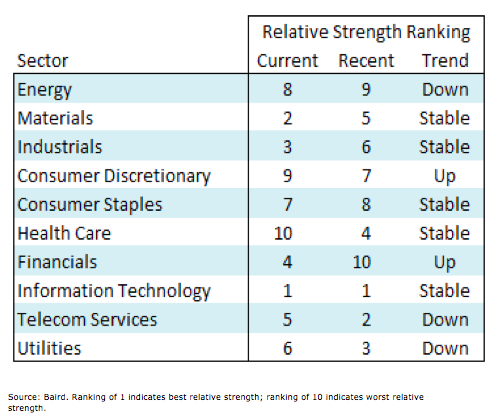
The sector rankings are showing a distinct shift in leadership that could have bullish implications for the overall stock market. Defensive sectors (Utilities, Telecom, Consumer Staples) have moved out of the leadership group. Leadership now has a cyclical bias, with Information Technology, Materials and Industrials at the top of the rankings. The weakness in defensive areas is not just a relative strength trend – areas that attracted large inflows over the course of the first half of the year are starting to see significant outflows.
The rise out of the cellar by the Financials sector is especially noteworthy, as it tends to have leading characteristics for the overall market. It may also be signaling that the nascent rise in bond yields seen over the past two months may have some staying power.
Thanks for reading.
Twitter: @WillieDelwiche
Any opinions expressed herein are solely those of the author, and do not in any way represent the views or opinions of any other person or entity.

: Showing Some Signs of Emerging Strength")
