Near-Term Risks May Be Longer-Term Opportunities. Highlights from our investing strategy outlook into year-end:
- In 2015-16 Seeing Echoes of 2011-12
- Valuations Especially Stretched For Defensive Groups
- Tightening Presidential Polls Could Bring Volatility
- Breadth Trends Bullish, But Momentum Has Faded
Stocks began the month of August in consolidation mode and finished the month still in consolidation mode. Normal seasonal doldrums are partially responsible for this, but at the same time realized volatility on the S&P 500, the VIX Index (INDEXCBOE:VIX), fell to a 20-year low in August. The perception that stocks, as measured by the S&P 500 (INDEXSP:.INX), have gone quiet of late is supported by the data.
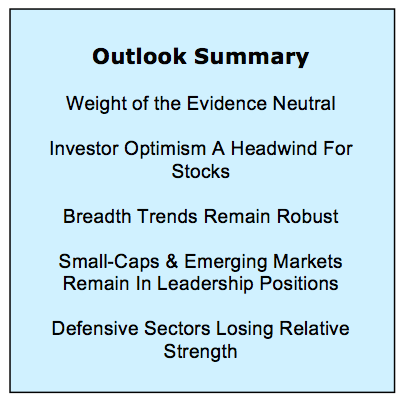
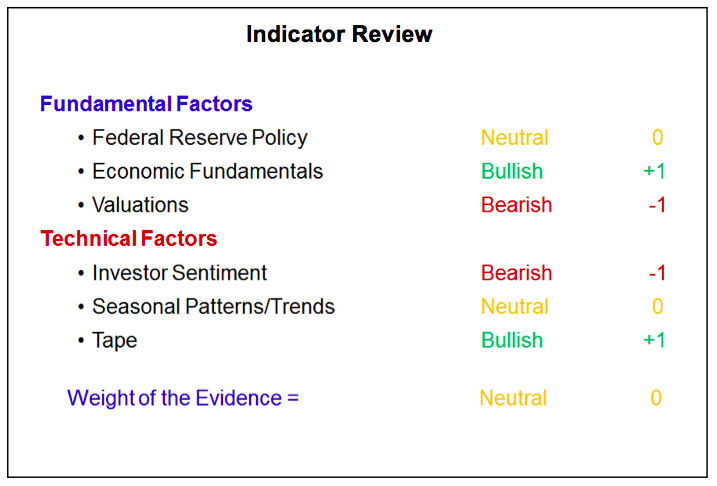
In considering what might happen next, we rely on our Weight of the Evidence. In August this was downgraded from Slightly Bullish to Neutral.
Behind the downgrade in the weight of the evidence is the shift in Sentiment, which moved from neutral to bearish. This reflects evidence that bears capitulated on the rally to new highs, leaving optimism at excessive levels and little cash on the sidelines. The combination of excessive optimism, a loss of broad-market momentum and a tightening presidential election could weigh on stocks (and our investing strategy outlook) as we move into the fall.
A saving grace may be that September’s notorious track record for stocks (down on average 1% and posting gains less than 50% of the time) has been well advertised. Also working in the favor of the bulls are the still-robust readings in cumulative breadth measures. While the rally may have lost a step in August, breadth trends continue to be bullish and show a night-and-day difference between this year and last. The way it looks now, any pullback/correction that emerges could be limited in degree/duration and may just be a prelude to a well-supported rally that can carry into 2017.
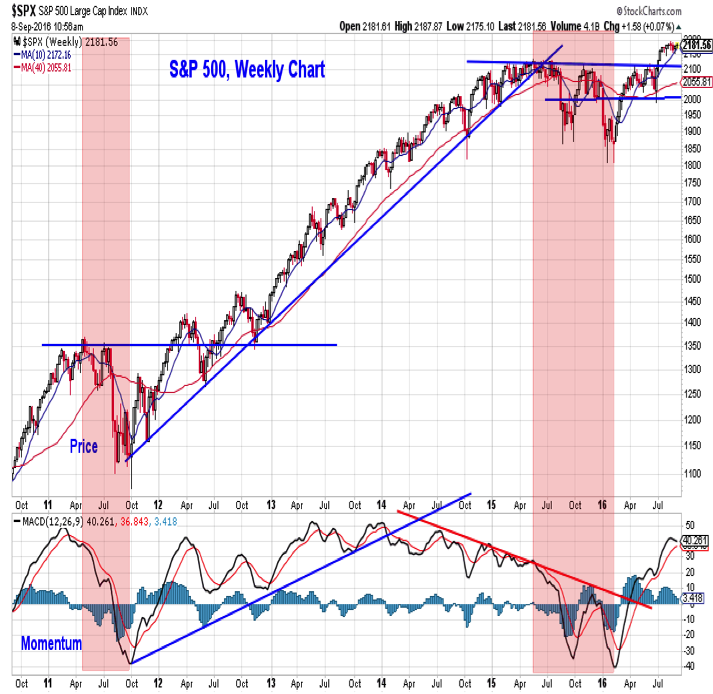
S&P 500 Index
The stock market correction from the May 2015 peak to the February 2016 low fits the definition of a cyclical bear market as characterized by Ned Davis Research (which includes both a price change and a time element in its definition). We are watching the pattern that followed the 2011 cyclical bear market for clues about 2016 and beyond. After the initial rally in the ensuing cyclical bull market carried the S&P 500 to new highs, momentum cooled and the S&P 500 found support not at the previous highs, but at the 40-week average. If that holds true this time around, look towards 2060 for good support. Importantly, a modest correction at this point does not need to cast doubt on the health of the bull market.
Fed policy is neutral. The Fed remains in a box of its own making, allowing the perception to develop that it is looking at the latest monthly changes (as opposed to longer-term trends) in employment or inflation data in determining the course of monetary policy. Breaking the market of this conception would mean doing something unexpected. A 25-basis point rate hike in September would fit the bill, but we view such an action as unlikely at this point. The trends in the labor market, particularly the record number of job openings and the continued drift higher in voluntary quits, suggest the economy is moving towards full employment (a Fed mandate). This supports our view that Economic fundamentals are bullish.
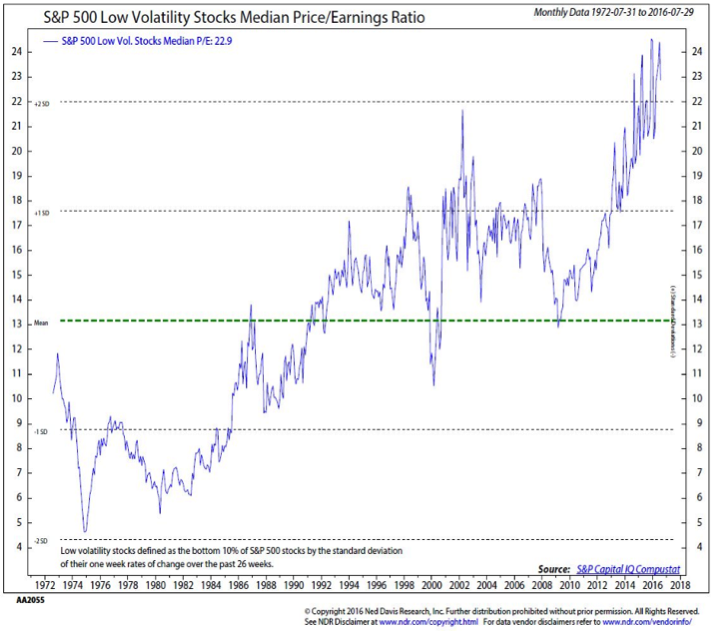
Valuations overall remain bearish. If the economy is indeed able to find its footing in the second half of the year, better sales growth could fuel an earnings rebound and that could help relieve some of the valuation excesses (those if’s have been repeated often enough that we would like to verify before trusting). Even more concerning that the excessive valuations seen in the market overall (which are about one standard deviation away from the long-term norm) are the valuations excesses being seen in low volatility stocks (particularly the Utilities sector). Here valuations are more than two standard deviations away from their historical norm. This is a crowded and expensive area of the stock market that has already begun to lose relative strength (more on this when we look at the sector rankings).
Market Trends & Investor Sentiment
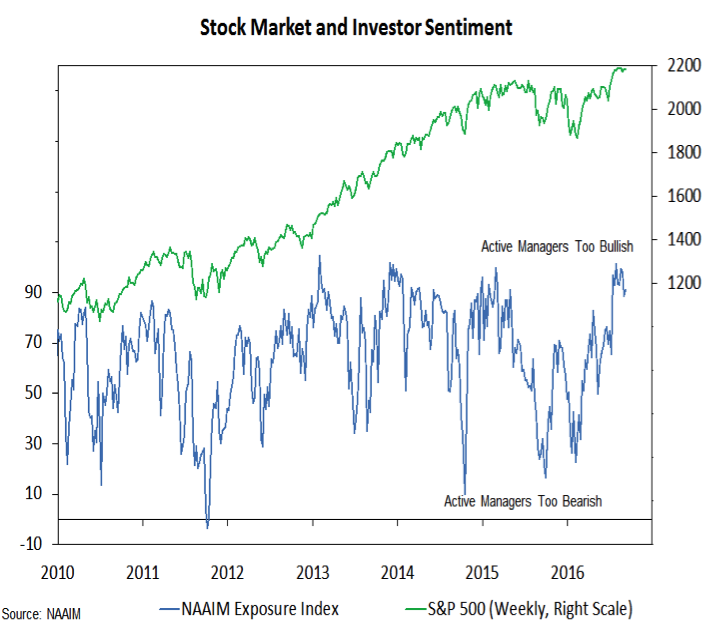
Investor Sentiment has turned Bearish. The pockets of optimism that emerged as stocks rallied in July became deep-seated enough in August that we downgraded sentiment. There has been some evidence that optimism has waned as stocks have corrected through time, but until we see evidence of excessive pessimism, this is more of a headwind for stocks than anything else. On a short-term basis, the NDR trading sentiment composite has moved to a 2-month low but it remains in the neutral zone. Over the past 3+ years, all the gains for the SP 500 have come when it has been in the excessive pessimism zone. The NAAIM exposure index, on the other hand, has not seen much waning in optimism at all, posting readings in excess of 90 in 8 of the last 9 weeks.
continue reading on the next page…

: Showing Some Signs of Emerging Strength")

