While tax cuts have certainly helped fuel the ongoing improvement in earnings, strong economic growth (on both a real and nominal basis) has also played an important role.
Sales growth for S&P 500 companies is up over 10% over the past year (earnings have risen more than 26%). This earnings growth has been accompanied by record profit margins, which could come under some pressure as wages and employment costs rise.
Earnings estimates for the S&P 500 reflect both the effects of the tax cuts, but also still strong economic fundamentals.
In fact, an important longer-term shift may be emerging here. After growing accustomed to elevated estimates that move lower over time, we are now seeing estimates move higher over time. This may reflect a deeper positive shift in the economy.
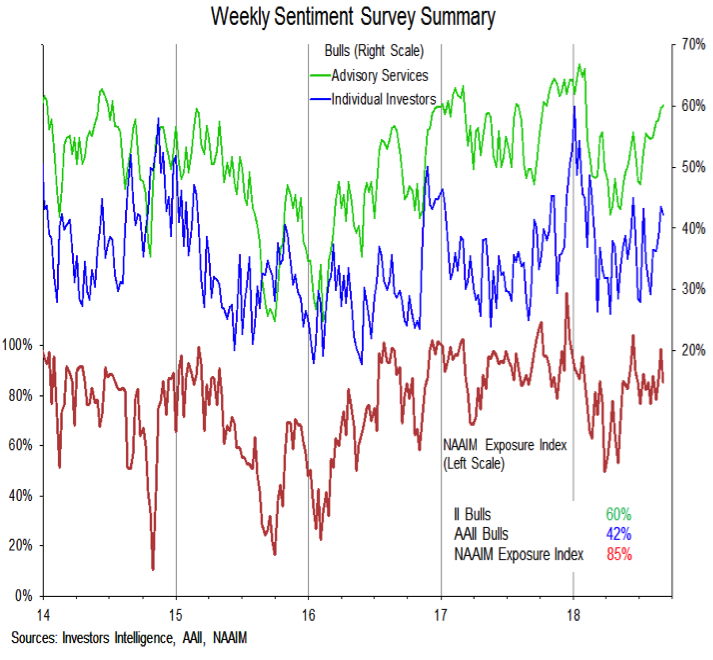
Sentiment is Neutral. The run-up to new highs on the S&P 500 has been accompanied by resurgent optimism among a variety of sentiment surveys. While still shy of the early-year peaks, optimism is moving higher when looking at bullish sentiment among individual investors and advisory services and in terms of the NAAIM exposure index.
Sentiment tends to peak before price, so optimism may well already be high enough to tilt view of sentiment to being bearish for stocks (remember, we view sentiment from a contrarian perspective). For now, however, we are keeping it at neutral as optimism and pessimism have ebbed and flowed swiftly with prices in 2018. That being said, sentiment indicators right now reflect a complacency and optimism in stocks that could exacerbate any near-term weakness that does emerge.
Seasonal Patterns Are Bearish. September has a well-deserved reputation as being a weak month for stocks. Concern and caution from a seasonal perspective, however, goes beyond just a single-month’s tendency to be a struggle for stocks. Stocks have historically struggled heading into mid-term elections and this has especially been the case in the face of domestic and international catalysts.
Given the deterioration in global conditions, ongoing domestic political disputes and the distinct possibility of a change in control of the House of Representatives, 2018 seems unlikely at this point to be a non-event year. The good news from a seasonal perspective is that these election-related headwinds could be short-lived and stocks have tended to rally after the election runs its course.
Breadth remains neutral. As we mentioned at the outset, the percentage of stocks in the S&P 500 trading above their 200-day averages has failed to confirm the strength being seen in the popular averages. Breadth has improved, but it has generally been following, not leading, price higher. That represents one of the three primary concerns we have from a breadth perspective. Our other two concerns are represented on the charts on this page.

The move off of the early-year lows was not accompanied by a breadth thrust (measured by a surge in the percentage of stocks above their 10-day or 50-day averages or by a surge in the 10-day advance/decline ratio). While the absence of breadth thrust does not preclude stocks from rallying, annualized gains for the S&P 500 since 1981 during periods following breadth thrusts have been nearly four times as large as those when a breadth thrust has not been signaled.
Finally, while U.S. stocks have moved to new highs, the rally has lacked global support. Both developed (represented on this chart by the EAFE index) and emerging markets have struggled in 2018, moving to new lows as the U.S. has moved to new highs. This is not only a function of dollar strength. Only one quarter of the 47 markets that make up the all-country world index are trading above their 200-day averages and only half have 200-day averages that are rising. Further deterioration in global breadth would be consistent with what have in the past been the early stages of a cyclical bear market. Breadth could get in gear, but for now it is not doing so and is more consistent with breaking down than breaking out.
Twitter: @WillieDelwiche
Any opinions expressed herein are solely those of the author, and do not in any way represent the views or opinions of any other person or entity.

 Trading Into Inflection Point")

 Ready To Break Out?")


