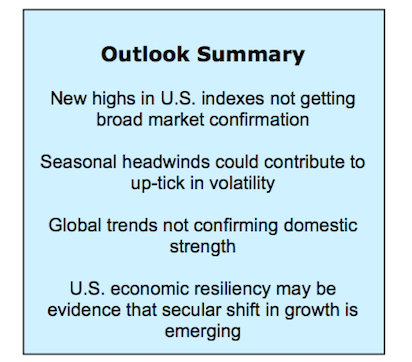
While stocks continue to float near all-time highs, the weight of evidence continues to argue for caution.
We’ll discuss several factors that are contributing to our near-term investing concerns.
Highlights:
- Fed Getting Into A Tight Spot With Inflation Perking Up
- U.S. Economy On Firm Footing
- Valuations Improving As Earnings Rebound
- Sentiment Indicators Show Optimism & Complacency
- Mid-Term Election Uncertainties Could Weigh On Stocks
- Lack Of A Breadth Thrust Suggests Move Lacks Momentum
Evidence that inflation is heating up in the U.S. could keep the Fed focused on pushing interest rates higher, but this is contributing to a widening spread between U.S. and international interest rates.
This in turn has supported a strengthening in the U.S. dollar which is contributing to some degree of global currency instability (notably among emerging market currencies).
Divergences between the United States and the rest of the world are not limited to interest rates and bond yields but can also be seen when looking at economic data and the performance of various stock market indexes. Growth in the United States is on firm footing and U.S. stock market indexes have recently traded at or near all-time highs. Global growth is showing signs of deterioration, global recession risk is on the rise, and both developed and emerging market equities have diverged sharply from U.S. stocks since mid-year. This divergence bears watching and is one reason it may be especially prudent to take heed of the cautious message from the weight of the evidence.
In addition to the global divergences cited above, the technical condition of the U.S. stock market is on uncertain footing. The rally to new highs has been accompanied by-less-than robust broad market participation. Investor sentiment is approaching the levels of excessive optimism seen in January. Seasonal headwinds could weigh on stocks as mid-term elections and the subsequent control of Congress come into focus. The message from the weight of the evidence is that investors should continue to have an eye toward risk and be prepared for at least a modest increase in volatility.
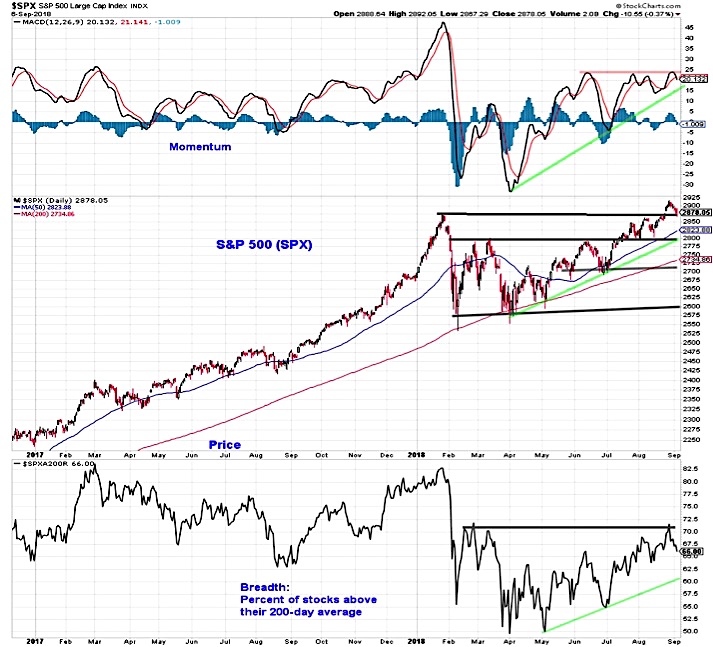
The S&P 500 has joined other U.S. stock market indexes in re-capturing its January highs. While price surpassed its January peak, neither momentum nor breadth joined in the celebration. Momentum has not only failed to return to the January high, but failed in August to surpass the June and July peaks. In terms of breadth, at the January S&P 500 peak, more than 80% of stocks were trading above their 200-day averages. The recent high was just above 70%. Both momentum and breadth have been making higher lows, but the lack of confirmation of higher highs bears watching. From a price perspective, the S&P 500 is extended to the upside after strong gains in both July and August. If September lives down to its historical reputation, recently passed levels could be tested. The confluence of trend lines around 2800 makes that an area of interest.
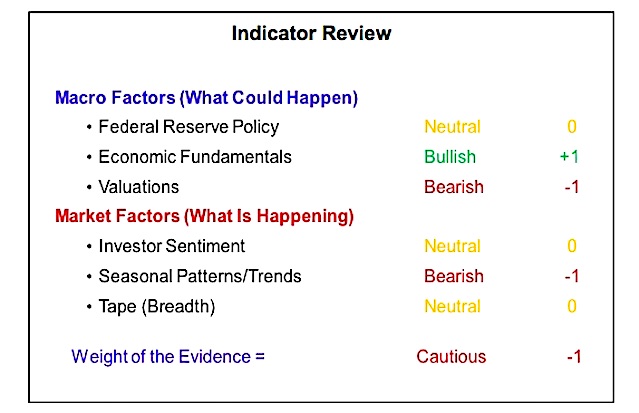
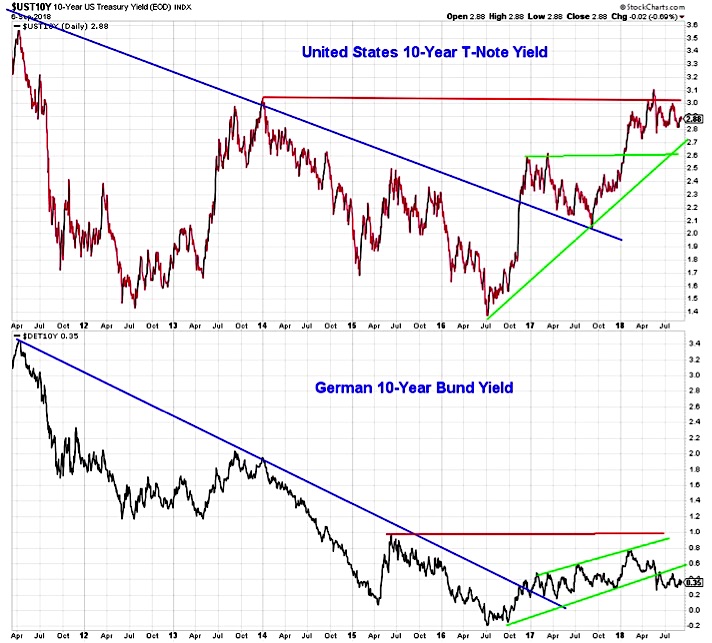
Federal Reserve Policy remains neutral. The Fed is poised to raise interest rates again in September (that would be the third rate hike of 2018, and the eighth overall since December 2015) and an additional hike in December remains on the table. While rate hikes to date have been largely about unwinding an accommodative stance, the path forward for the Fed is getting much trickier. The rise in U.S. bond yields is not being echoed overseas with the yield on the 10-year T-Note and the 10-year German Bund diverging since earlier this year. This is contributing to a strengthening in the U.S. dollar, which is contributing to volatility that is being seen in the currency markets (especially emerging market currencies).
Inflation
The tough position for the Fed comes from the evidence that inflation pressures have been building. While the Fed itself focuses on the core PCE price index to gauge inflation, economists at the Fed have found the Median CPI to be the best indicator of underlying price trends. The yearly change in the Median CPI has moved steadily higher over the past year (rising from 2.2% to 2.8%) and is now at its highest level in nearly a decade. The August jobs report showed an expected jump in wages, which is now up 2.9% over the past year. While not excessively high from historical standards, the trajectory for both wages and inflation is higher. This could compel the Fed to remain in a tightening mode once it reaches a neutral policy rate even if it exacerbates global conditions that are deteriorating.
Economic Fundamentals remain Bullish. This increasingly applies to only the United States. While the global economy remains on a growth path, the pace of the expansion, as seen by the global manufacturing PMI, is slowing. The U.S. PMI, however, has moved to its highest level in over a decade and the Atlanta Fed’s GDPNow tracker suggests the 4.2% growth seen in the second quarter could be followed by growth in excess of 4% in the third quarter. Recession risk is on the rise overseas, but remains minimal in the U.S. Initial claims for jobless benefits, which tend to spike before weakness emerges in other economic indicators just moved to their lowest level since 1969.
Valuations remain Bearish. The good news is that valuations have improved even as stock prices have moved back to their early year highs. This reflects the strong growth in earnings that has been seen in 2018 and is expected to continue into 2019 (more on this in a moment). The bad news is that even with this improvement, valuations remain elevated by historical standards. This suggests more work is needed (from either a price correction or earnings growth perspective). Excessive valuations are not just a function of a few expensive stocks. The median P/E ratio for the S&P 500 which has shown similar improvement to the Value P/E ratio (shown here) remains elevated.
continue reading on the NEXT PAGE…


