Over the long weekend, I worked through some core stock market charts and noticed something very curious in volatility land.
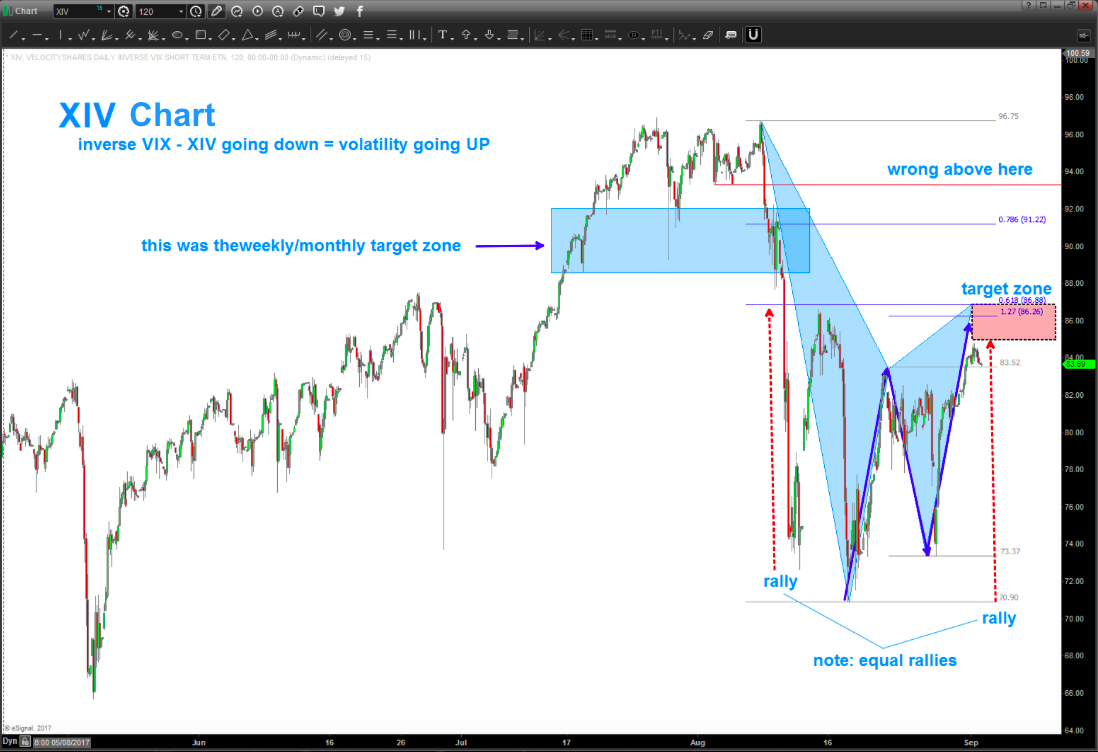
In short, the Inverse VIX Volatility Short-Term ETN (NASDAQ:XIV) is forming a ‘classic’ sell signal. And, if this holds, we could see another move lower soon.
Looking at the chart below, I noticed a 5 wave move lower (not labeled). This would assume that the recent move/rally higher is corrective and therefore we should see another wave lower.
Now, that’s what this pattern is telling me… and, as I always say, some patterns work and some don’t. They simply help us to define risk. This pattern is definitely wrong if XIV rallies up past 94.
But until then, this pattern is active and could mean more volatility for stocks in the days or weeks ahead. Here’s what I’m seeing on the chart below:
- The dashed red arrows are showing equivalent rallies, with the recent one completing on Friday
- The PATTERN in play completed a sell signal around 86.26-86.88.
- If we blow through this initial price target, then the 91.22 area is next and anything above 94 (on a daily close) tells me that the pattern is wrong and XIV (and the market) is going higher.
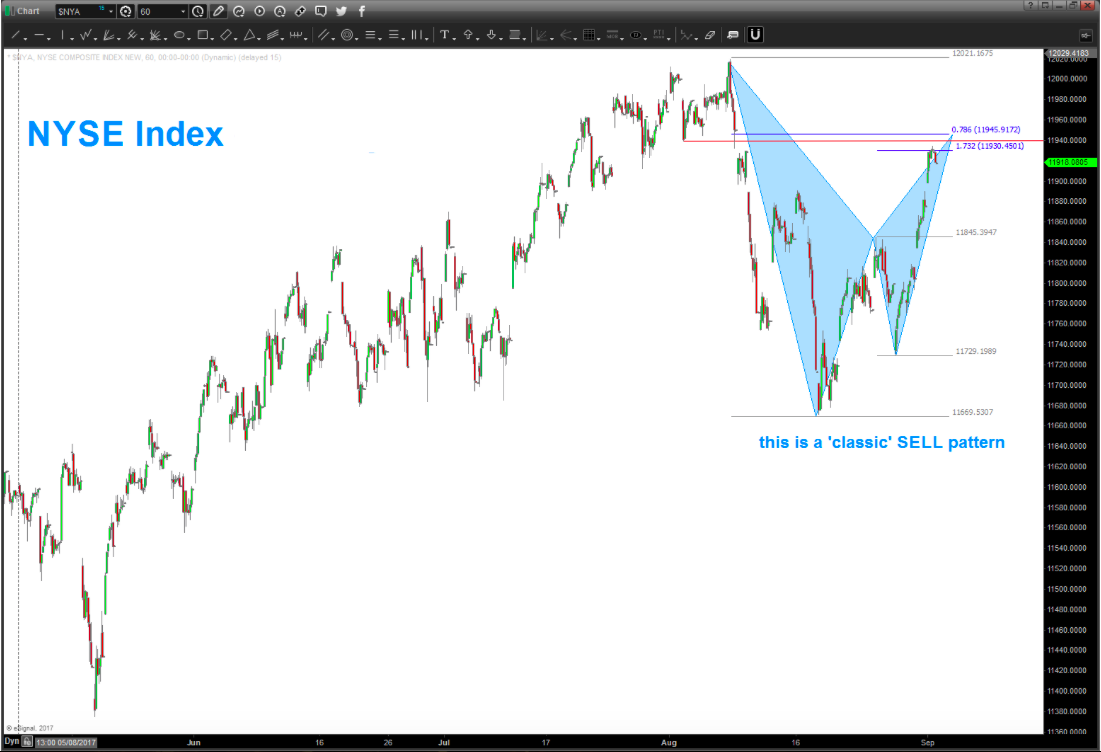
It is also worth noting that a similar pattern setup can be found on the NYSE Composite Index.
Twitter: @BartsCharts
The author does not have a position in mentioned securities at the time of publication. Any opinions expressed herein are solely those of the author, and do not in any way represent the views or opinions of any other person or entity.


