Well it looks like the Fed’s rate hiking cycle is finally underway in earnest this time, with the March hike making the chart of interest rates look a little more familiar to the previous 2 hiking cycles, rather than the 1997 one-and-done hike.
I previously highlighted a rule of thumb for when interest rate hikes start to matter for the market, but in this article we take a quick look at how the S&P 500 (INDEXSP:.INX) has previously trade in comparison to the Fed funds rate by itself (as well as a somewhat unusual indicator known as the shadow rate).
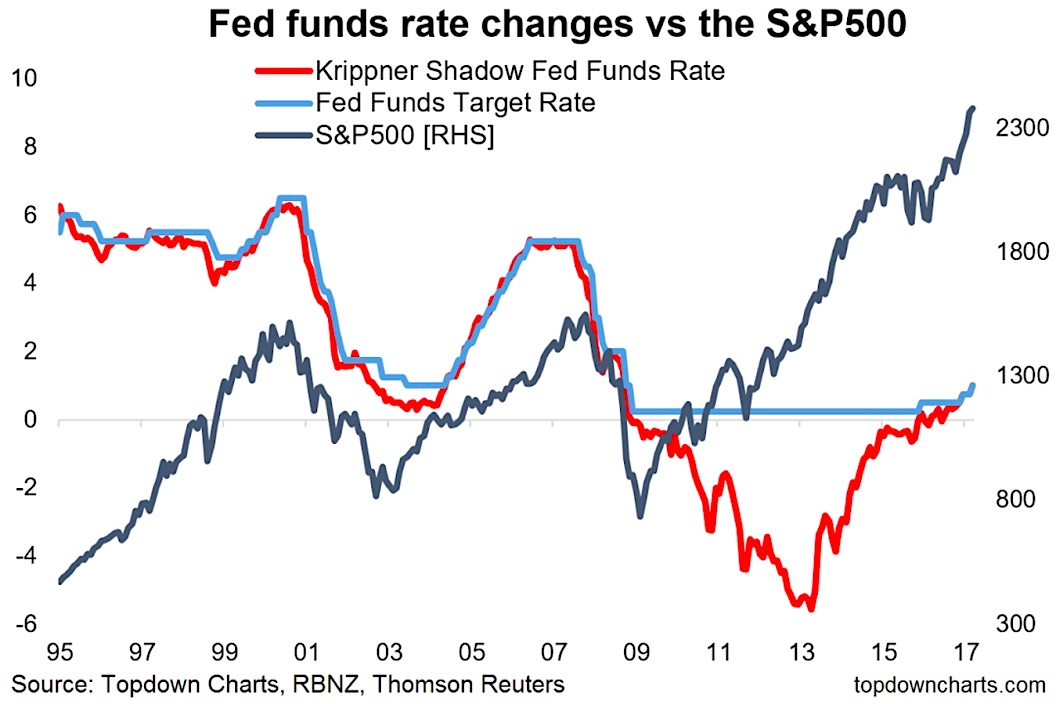
The chart comes from the latest edition of the Weekly Macro Themes and there’s a couple of observations to highlight.
First is it usually takes a series of rate hikes before the negative impacts are really felt by the market. Second, it’s worth noting that the market usually actually rallies during the early phase of rate hikes (because rate hikes should be reflecting stronger economic conditions).
But another important observation has to do with that red line. The shadow Fed Funds rate shows that there was effectively already a very significant tightening cycle off the lows in 2013. As a matter of fact you could probably argue that this stealth or shadow hiking cycle was a key driver of the market turmoil in 2015/16 that drove a series of corrections and pushed a couple of sectors into recession. In a way the 2015/16 period was like a mini-recession or quasi-recession, and that “reset” helped pave the way for thew new hiking cycle and the renewed bull market that we are seeing now.
It’s an important theory because it essentially argues that we are more mid-cycle vs late-cycle. Basically the later we are in the cycle, the less gas there is in the tank for markets and the economy.
If you think it’s unusual, or even that the market environment is unusual, that’s because it is! We can still draw lessons from history, but it’s an environment that requires flexibility in thinking and approach and one that lends itself to investors who take the path of constant improvement and who look to broaden and build their indicator set.
Thanks for reading.
More from Callum: S&P 500 Sector Level Analysis: Where’s The Bubble?
Twitter: @Callum_Thomas
Any opinions expressed herein are solely those of the author, and do not in any way represent the views or opinions of any other person or entity.

: Showing Some Signs of Emerging Strength")

