In the course of my work as a technical analyst, I’m often asked about price support and resistance levels.
Why do specific price levels seem to have meaning for a particular chart? I would argue that part of the reason has to do with anchoring. Investors often anchor to their entry points. And when the price gets back to their original entry point, you could expect those same investors to be motivated to buy at those same levels.
In today’s video, we’ll identify key price support and resistance levels for the S&P 500 Index as well as Amazon stock (AMZN). We will discuss why those particular price levels may be more important than others and also review how support and resistance trading can help you stay on the right side of the right charts!
Here are a few questions that we attempt to answer in today’s video:
- How do you select the most important support and resistance levels on a chart?
- For how long do particular support and resistance levels remain relevant?
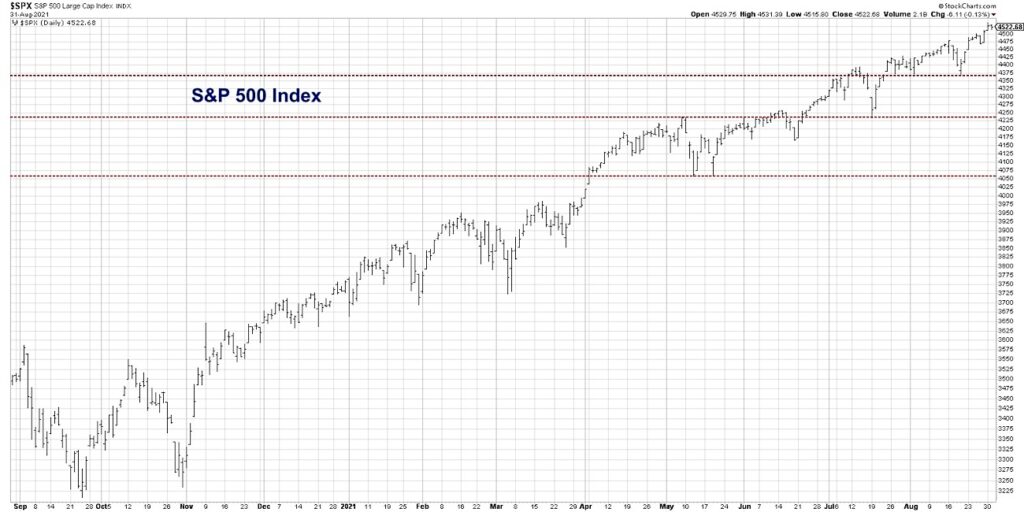
- Why is the 4300 level so meaningful for the S&P 500, and where should we expect potential resistance for AMZN?
Ready to upgrade your investment process? Check out my free course on behavioral investing!
One Chart [VIDEO]: S&P 500 Index and Amazon (AMZN)
S&P 500 Index Price Chart
Twitter: @DKellerCMT
The author may have positions in mentioned securities at the time of publication. Any opinions expressed herein are solely those of the author, and do not in any way represent the views or opinions of any other person or entity.

: Showing Some Signs of Emerging Strength")

