The pattern in a leading index of German equities could be very favorable for bears. Although the scenario of a decline still lacks confirmation, the current area on the charts merits a trader’s attention in coming weeks.
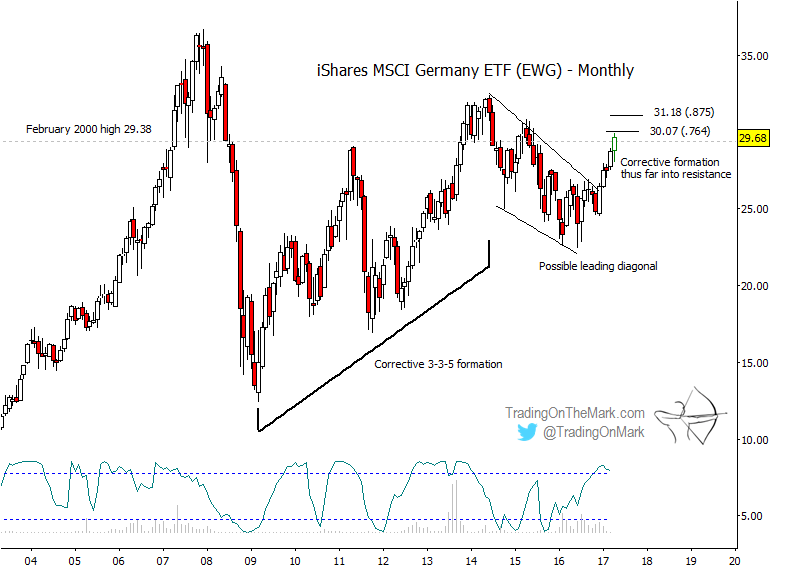
The iShares MSCI Germany ETF (NYSEARCA:EWG) tracks an index comprised of 59 large-cap German companies. In the big picture, the move up from the 2009 low appeared corrective as it formed a (provisionally) lower high in 2014. That opens the possibility of another strong downward move for german equities (forming from the 2014 high).
Although the pattern is messy, the decline from 2014 to 2016 might be counted as a leading diagonal first wave that could initiate a big decline. The rally during the past ten months still qualifies as a potential upward retrace, which might be a second wave. That scenario would gain traction if the rally stalls and reverses near the present area that represents typical retracement values.
In particular, the pattern on a monthly time frame might encounter resistance near a Fibonacci 76.4% or an 87.5% retracement at 30.07 and 31.18 respectively.
The price cycle as calculated by the Lomb periodogram at the base of the monthly chart now favors the idea of upward exhaustion. The present area also represents a test of the 2000 high, suggesting a massive head-and-shoulders pattern as a possibility.
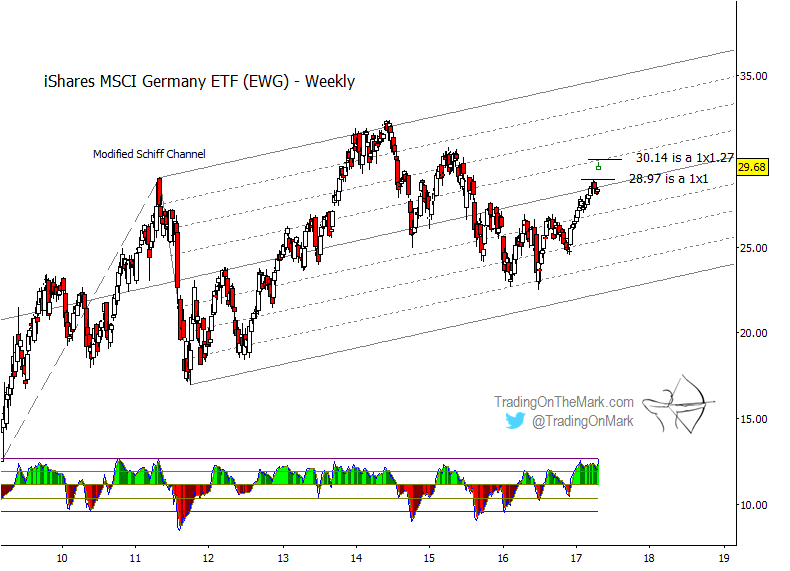
A reversal near the present area for german equities is not a certainty but is merely something to watch for. On a weekly chart, we note that price jumped above a 1×1 measured resistance level to test the Fibonacci 1×1.272 level. Initial confirmation of bearish developments might consist of price falling (or jumping) back beneath the 1×1 at 28.97 and then failing to climb back over it a second time.
EWG is especially prone to “island reversal” patterns, and the recent jump may be forming that type of island. Traders should be prepared to look for entry opportunities if/when it starts to look as though that island is being left behind.
Subscribers to our website service have access to these charts and more. We hope you’ll take advantage of the special value we’re offering right now for new subscribers. Check out the details of our daily and intraday analysis services, available for a brief time at savings ranging from 17% to 27%. The offer is available until Sunday, May 6, and it will not be repeated this year.
Thanks for reading.
ALSO READ: iShares Italy ETF Nearing Elliott Wave Target
Twitter: @TradingOnMark
No position in any of the mentioned securities at the time of publication. Any opinions expressed herein are solely those of the author, and do not in any way represent the views or opinions of any other person or entity.


