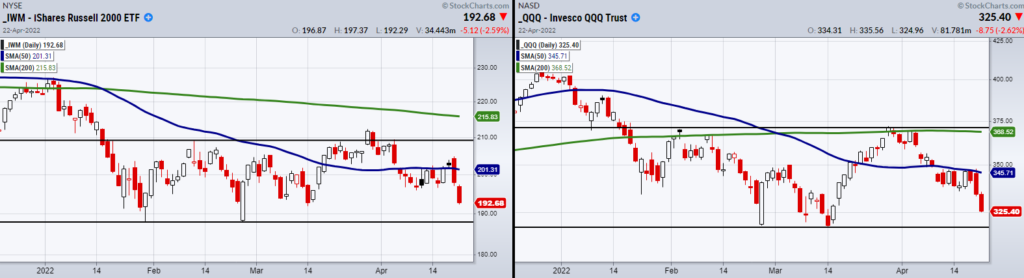
After both the Russell 2000 (IWM) and the Nasdaq 100 (QQQ) failed to hold or clear over the 50-day moving average (blue line), the bleeding has not stopped.
Now that IWM and many key ETFs are near the bottom of their trading range, how should we prepare for next week?
Because we are in a stagflation type of environment with weak market growth and rising inflation, we need to be extra careful with how we trade.
This led us to believe that trading ranges would give us important areas to watch for entries to the long and short side.
As seen in the above chart IWM, and QQQ have been rangebound for some time. Range highs and lows are shown with black lines.
However, we can extend watching ranges to other key symbols such as the transportation (IYT), retail (XRT), and biotech (IBB) ETFs.
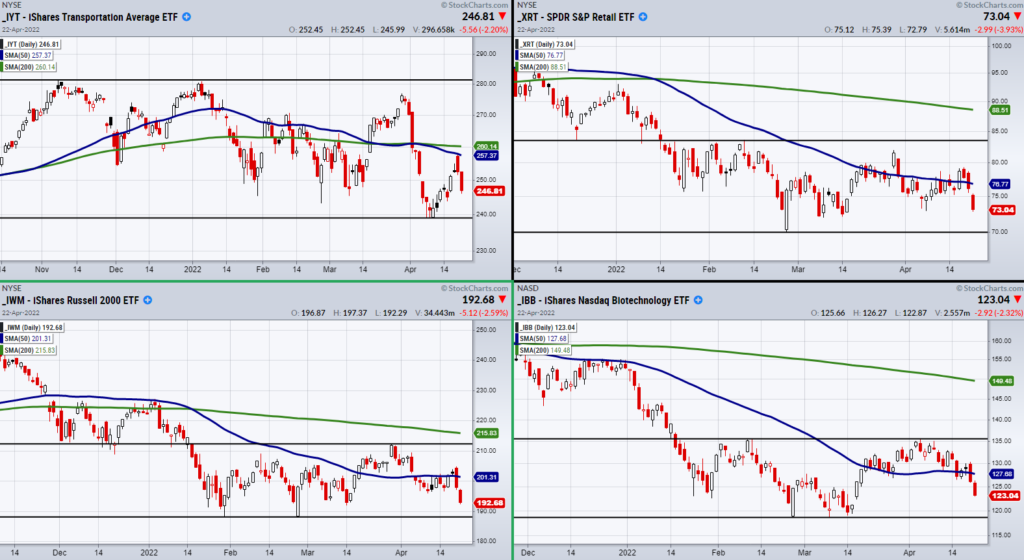
When looking at Monday’s trading session, this can help show if we should watch for a bounce near support from the range low or watch for the market to continue breaking down.
If only a couple of symbols break the range low, the weak price action could show that the market is looking to bounce.
On the other hand, if the ETFs break lower in unison, we could expect another leg down in the market.
Currently, many traders are watching the market from a bearish standpoint. While this can be helpful at times, it can also be frustrating if the market decides to trend sideways or stay rangebound.
Therefore, keep an eye on ranges in these symbols along with anything you are currently watching for trade setups in.
With volatile and choppy markets, traders and investors need to know when to put your money to work and when to sit on the sidelines. Watch this week’s edition of MISH’S MARKET MINUTE.
Stock Market ETFs Trading Analysis & Summary:
S&P 500 (SPY) 415 is the next price support.
Russell 2000 (IWM) 191 is the next support.
Dow Jones Industrials (DIA) 336 is a support area.
Nasdaq (QQQ) 317 is price support.
KRE (Regional Banks) 63.80 is the next support.
SMH (Semiconductors) Broke support from 237.
IYT (Transportation) 243 is minor support.
IBB (Biotechnology) 118 is the next support.
XRT (Retail) 73 needs to hold.
Twitter: @marketminute
The author may have a position in mentioned securities at the time of publication. Any opinions expressed herein are solely those of the author and do not represent the views or opinions of any other person or entity.


 Rolling Over At Key Fibonacci Level?")

 Ready To Break Out?")