Currently, the market is digesting last Friday’s big move and is not giving us any clear directional signs.
After the major indices failed to clear key resistance levels last week the market began to sell-off.
Though Monday is showing a continuation from the previous Friday with a fair amount of selling, the overall range is small and tough to read as there is no obvious winner from the long or short perspective.
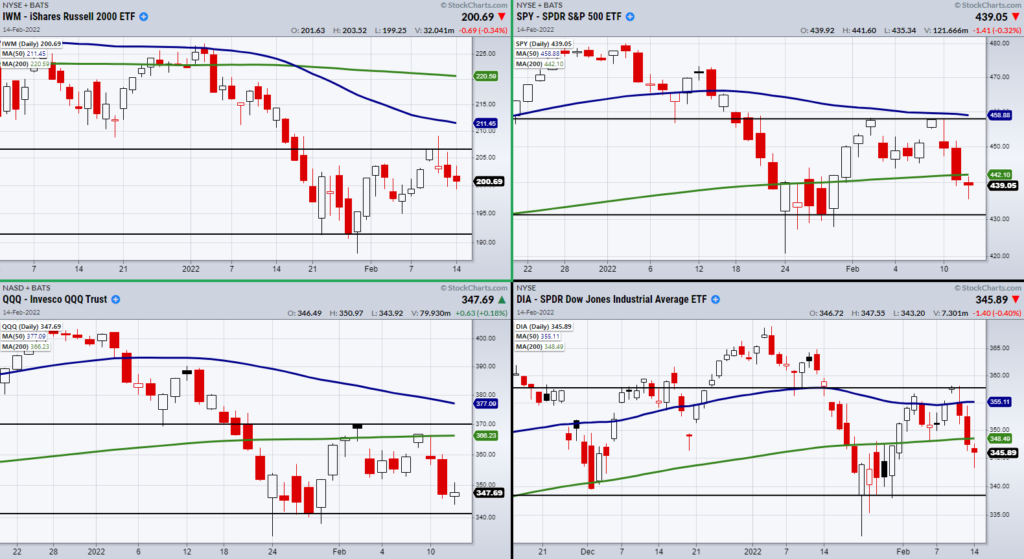
This can be seen in the above chart of the four major indexes.
The big question is what comes next and how can we prepare for the rest of the trading week.
It’s commonly thought among new traders that if you search hard enough, there is always money to be made.
In hindsight, there are always trades someone could have turned a profit in.
However, that does not mean you should always be in the market.
Monday can easily be a day that teaches us the importance of waiting from the sidelines for a better opportunity.
We have neither made a significant selloff nor cleared any important support levels.
With that said, if the market stays stuck within the middle of its current range, sitting on the side, and waiting for a better setup could be the best plan for the moment.
Impatience in the market can be very costly.
The above chart shows the support and resistance areas we are watching.
Timing trades from breaks or bounces off these areas can greatly increase success in trading equities in the short term.
Stock Market ETFs Trading Analysis & Summary:
S&P 500 (SPY) Needs to clear back over 200-DMA around 444.
Russell 2000 (IWM) 201.48 pivotal area.
Dow (DIA) Watching to hold current 345 area as support.
Nasdaq (QQQ) 338 support area.
KRE (Regional Banks) 72.52 support area.
SMH (Semiconductors) Needs to clear the 200-DMA t 270. 249.46 main support area.
IYT (Transportation) Minor support from Fridays low at 256.08.
IBB (Biotechnology) Broke 129 support level.
XRT (Retail) 83.14 resistance area. 75.62 support.
Twitter: @marketminute
The author may have a position in mentioned securities at the time of publication. Any opinions expressed herein are solely those of the author and do not represent the views or opinions of any other person or entity.


")

