The S&P 500 Index has pushed above 3151 and this helped to kick in the algos and a strong rally.
The broad stock market index is back in all-time high territory.
The latest advance is led by Financials (XLF) and Energy (XLE) stocks, both of which were up nearly 2% on Thursday.
Technology and Materials also made sharp moves of over 1% yesterday, but breadth overall came in at just 3/2 positive, as markets showed some definite selling pressure in many of the Defensive groups.
Consumer Staples, Utilities, Telecom and Real estate were all down on the day, and given early rumors of a trade deal being close, which then were later confirmed into and after yesterday’s close
S&P 500 ETF (SPY) volume yesterday finished the highest we’ve seen since October 11, over two months ago. This is considered a near-term positive.
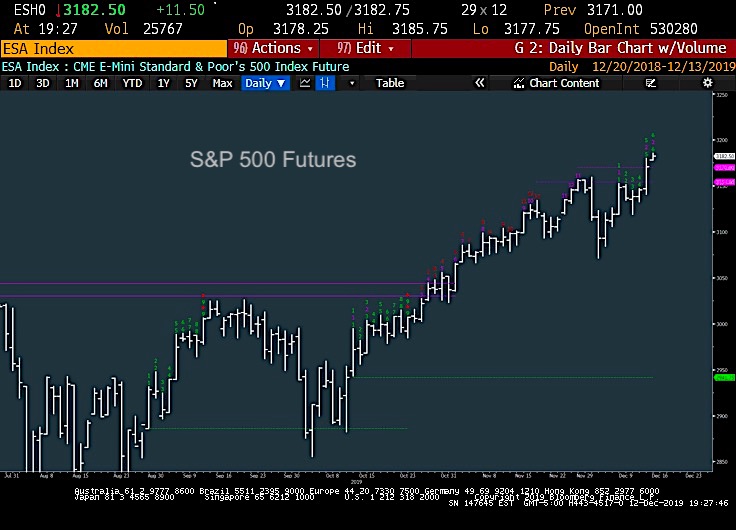
Trump’s comments of a trade deal being close wasn’t necessarily all that different than what’s been said in recent weeks. Yet when S&P got over 3151, there was definite signs of structural improvement in the near-term and seeing both Tech and Financials up over 1% has traditionally been a very good sign for the market.
Outside of the move in Stocks, we saw commodities spike even further along with Emerging markets despite the Dollar making a brief rally as Pound Sterling sold off into the election results.
Precious metals which had spiked early in the day, gave back all their gains after news of the Trade deal, and with yields and US Dollar moving higher, metals found it tough to keep their Bid. The Yield move caught many by surprise, and the close at multi-day highs for yields should lead yields even higher in the near-term, in the days ahead. (Charts on this below)
The Bottom Line: This “should” be the move to sell into early next week, given that overbought conditions are now present, and we’ve seen pretty chronic negative momentum divergence in recent weeks on a daily basis, which has been ongoing on Monthly charts.
Trends are naturally quite bullish, and most will go out of their way to extrapolate this into the future indefinitely. Yet the small-cap breakout that we keep hearing about has been short-term only. Russell 2000 still has not gotten back to new all-time high territory above last Fall’s highs, while groups like Transportation have lagged badly, and this also has been conveniently forgotten by many. Charts and more explanation below
If you have an interest in seeing timely intra-day market updates on my private twitter feed, please follow @NewtonAdvisors. Also, feel free to send me an email at info@newtonadvisor.com regarding how my Technical work can add alpha to your portfolio management process.
Twitter: @MarkNewtonCMT
Author has positions in mentioned securities at the time of publication. Any opinions expressed herein are solely those of the author, and do not in any way represent the views or opinions of any other person or entity.


