2000 Dot-Com Market Peak: The 200-Day Moving Average Was Helpful
“I think one of the secrets to trading success is cutting down the number of trades you make.” – Michael Marcus, Market Wizards
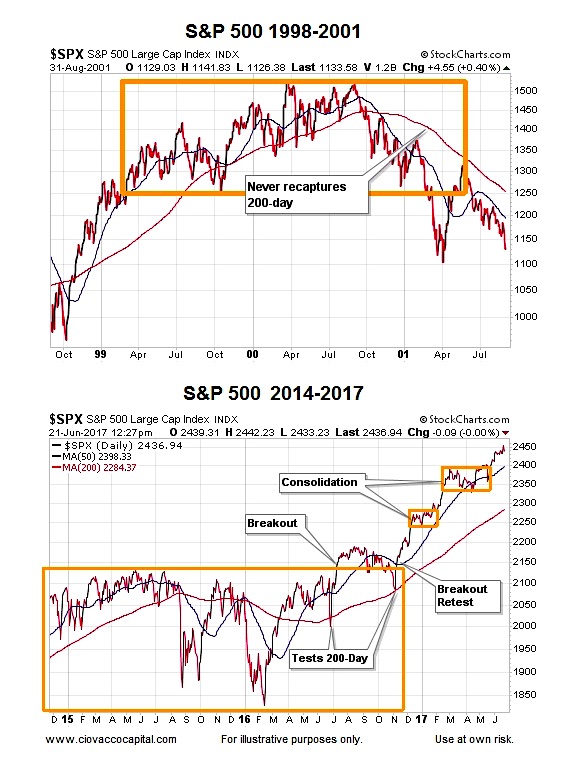
A market’s 200-day moving average (thin red line in charts below) can assist in monitoring investors’ net aggregate tolerance for risk.
Notice in the first chart below the S&P 500 Index (INDEXSP:.INX) was unable to recapture its 200-day moving average after dropping below it in October 2000. Compare and contrast the top chart to the bottom chart; notice how unlike 2000, the S&P 500 was able to recapture and hold above its 200-day after the Brexit bottom was made in June 2016. In the bearish case (top chart), once the S&P 500’s 200-day moving average rolled over, it was unable to turn back up in a bullish manner. In 2016 (bottom chart), the 200-day turned back up telling us to be open to better than expected longer-term outcomes.
The Three Most Important Questions For Investors
This week’s video looks at long-term economic and financial market evidence to address the question “does history support the notion that the world is on the brink or that things tend to gradually get better over time.” The video covers numerous charts to assist in combating the human tendency to focus on narrow timeframes.
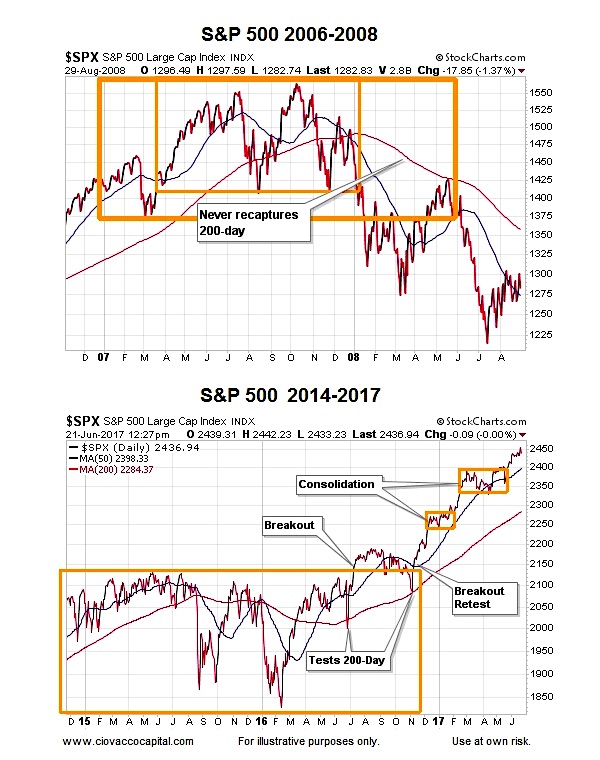
2007-08 Financial Crisis Peak: 200-Day Was Helpful
The situation was similar in 2007-08. Notice in the first chart below the S&P 500 was unable to recapture its 200-day after dropping below it in December 2007. Compare and contrast the top chart to the bottom chart; notice how unlike 2008, the S&P 500 was able to recapture its 200-day in 2016 after trading below it for several months.
ALSO READ: Are Investors Staring A Generational Opportunity In The Eye?
Removing Price Allows Us To Focus On Trends
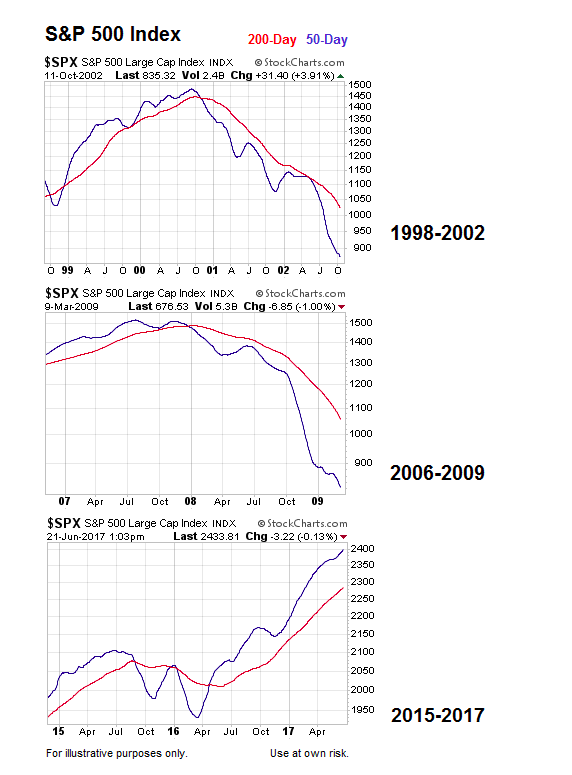
The concept of trends is easier to see if we remove the day-to-day fluctuations in price from the equation. Notice how during the dot-com bust bear market, the S&P 500’s 50-day moving average (blue) was never able to recapture the 200-day moving average (red). Compare and contrast the look of the market’s bullish turn in 2016 (second chart below) to the look in 2000-2002 (first chart below).
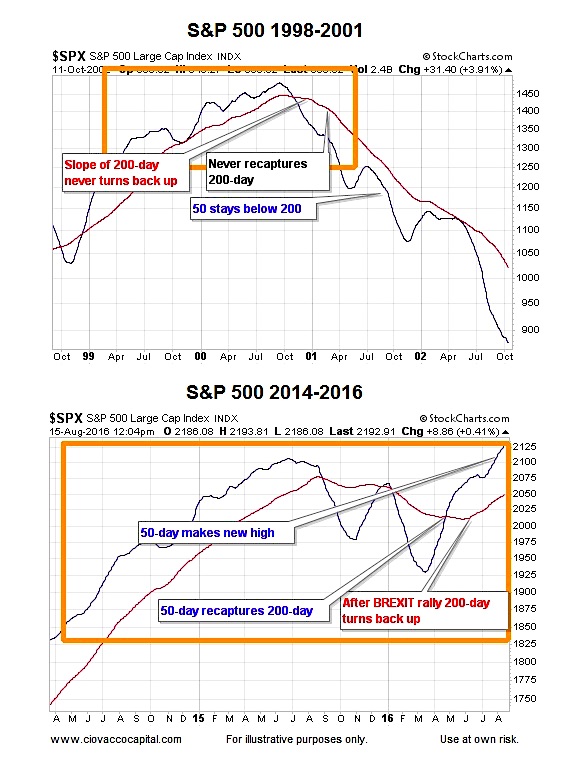
In the 2016 chart above, two favorable things took place that never occurred during the dot-com bear market: (1) the slope of the S&P 500’s 200-day turned back up in a positive manner, and (2) the 50-day crossed back above the 200-day.
Similar Concepts 2007-08 vs. 2016
Notice how during the financial crisis bear market (top chart below), the S&P 500’s 50-day moving average (blue) was never able to recapture the 200-day moving average (red). Compare and contrast the look of the bullish turn in 2016 to the look in 2007-2008.
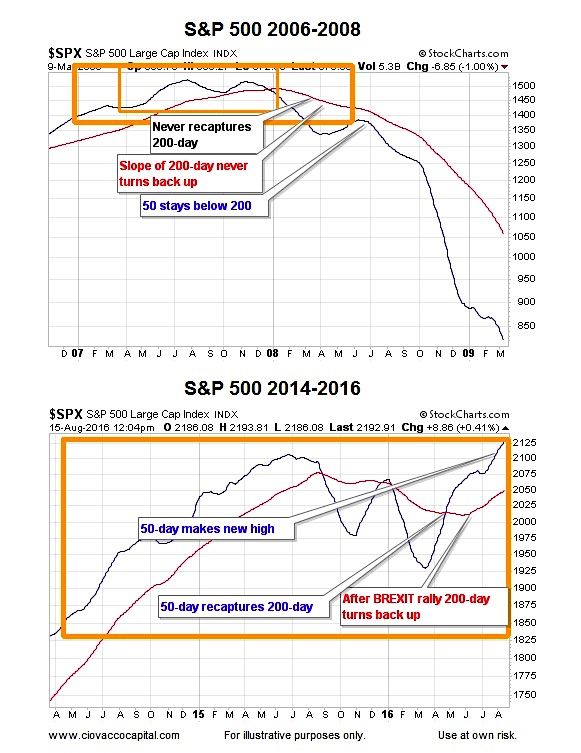
In the 2016 chart above, two favorable things from a trend perspective have happened recently that never occurred during the financial crisis bear market: (1) the slope of the S&P 500’s 200-day turned back up in a positive manner, and (2) the 50-day crossed back above the 200-day.
How Can These Charts Help Us?
Charts cannot predict the future. However, charts and moving averages can help us better understand the “probability of good things happening” vs. “the probability of bad things happening”.
Right now, given the look of the 2017 charts above, the probability of good things happening, looking out weeks, months, and years, is much higher than it was in early 2001 and early 2008. Nothing says the 2017 chart cannot breakdown and morph into a look similar to 2001 or 2008. However, that has not happened yet. Therefore, we will continue to hold positions in markets with positive trends, including U.S. stocks. The three charts below summarize the concepts presented above.
Thanks for reading.
Twitter: @CiovaccoCapital
The author or his clients may hold positions in mentioned securities at the time of publication. Any opinions expressed herein are solely those of the author, and do not in any way represent the views or opinions of any other person or entity.


