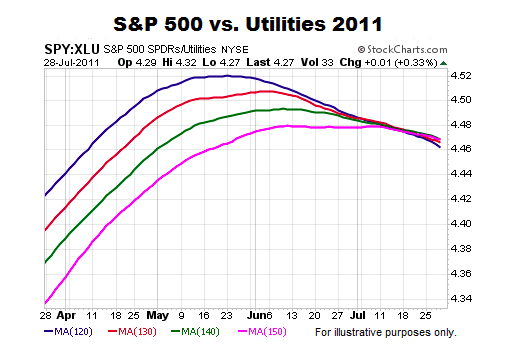
Income-Oriented Utilities vs. S&P 500
Common economic sense says the conviction to own income-producing utilities would increase as economic fear increases, which is exactly what happened in 2011. The long-term trend was starting to weaken in favor of defensive utilities over two months before the S&P 500’s plunge in late July/early August.
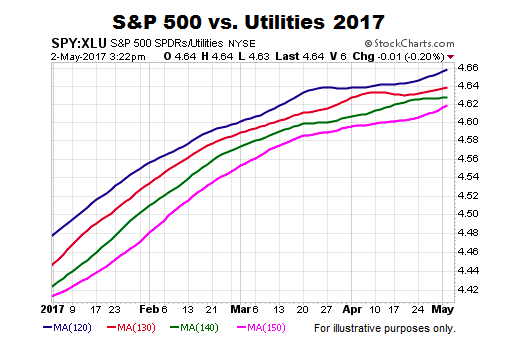
Are similar red flags waving in May 2017? The answer is not yet. The long-term trend turned in favor of the S&P 500 back in November 2016 and remains constructive for the S&P 500 looking out weeks, months, and years. These charts do not speak to the next few minutes, hours, or days.
This Is Extremely Rare
Last week, the S&P 500’s weekly chart printed something that is extremely rare. The rare occurrence is the main topic of this week’s stock market video.
After you click play, use the button in the lower-right corner of the video player to view in full-screen mode. Hit Esc to exit full-screen mode.
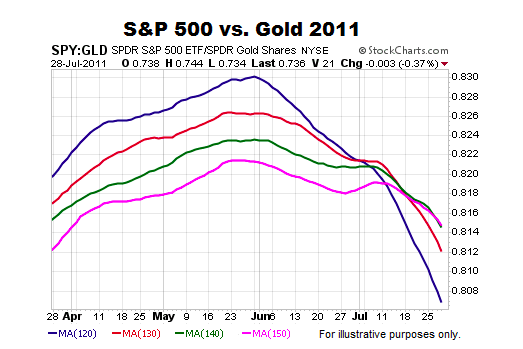
Stocks vs. Safe Haven Gold
When fear picks up, especially long-term fear, the demand for safe haven gold typically increases. The script was followed in 2011 with the long-term trend starting to flip in favor of gold well before the S&P 500 rolled over.
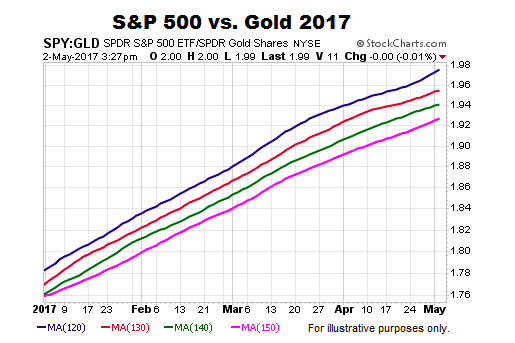
Is gold waving similar “the long-term trend in stocks needs to be watched very closely” signals in early May 2017? The answer is not yet.
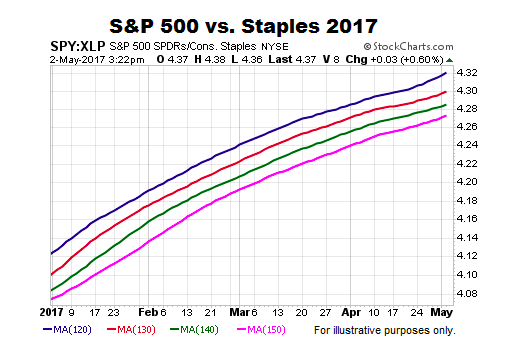
S&P 500 Relative To Defensive Staples
If we examine the S&P 500 relative to defensive-oriented consumer staples, we see similar trend deterioration in 2011 before the waterfall decline.
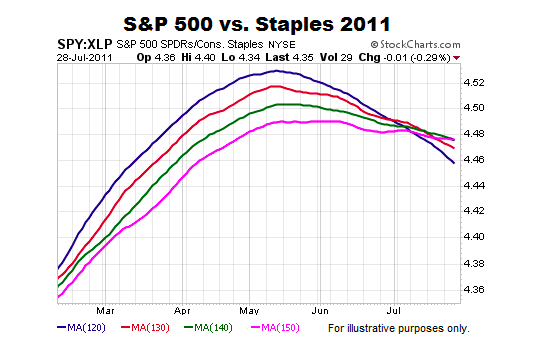
If large money managers were concerned about the long-term outlook for stocks, we would expect to see the conviction to own consumer staples increase relative to the conviction to own the broader S&P 500. It may happen, but it has not happened yet.
How Does All This Help Us?
The charts above help us assess the probability of good things happening relative to the probability of bad things happening. The probability of bad things happening never drops to zero.
If the Equal-Weight/S&P 500 ratio rallies above the three major Fibs, the probability of good things happening will start to improve. Conversely, if the ratio drops below and stays below all three major Fibs, the probability of further weakness in the broader stock market will increase.
Differences in asset class behavior and trend strength between July 28, 2011 (before the plunge) and May 2, 2017 tell us the present-day market has a higher tolerance for risk and stronger trends, which speaks to probabilities associated with pullbacks, the magnitude of pullbacks, and the duration of pullbacks. If the charts begin to shift in a meaningful way, the probabilities will shift as well.
Thanks for reading.
Twitter: @CiovaccoCapital
The author or his clients may hold positions in mentioned securities at the time of publication. Any opinions expressed herein are solely those of the author, and do not in any way represent the views or opinions of any other person or entity.


: Showing Some Signs of Emerging Strength")
