Thursday night I gave a talk at a bookstore in Albuquerque, New Mexico.
At every talk I have given, the Q & A lasts longer than the actual presentation.
Why?
Because most of the older folks who come to hear me speak about my book, are completely in the dark about their retirement accounts.
The younger folks (not nearly as much as there should be) are completely in the dark about how to time their way in and out of their investments.
That’s where a navigation system comes in handy. Having a compass, so to speak, prevents you from remaining in the dark.
I write and talk a lot about the six phases.
For the “daily” column, I stick mainly to the stock market phases of the Economic Modern Family of ETFs.
When one of stock market ETF improves in its phase, we know where money is rotating into.
When the whole Family of ETFs trends together, that is the best time to invest in the stock market.
When they trade in disparity, that is a good time to lay low.
This week, we still see disparity, but we also saw money rotate into three of the six member ETFs.
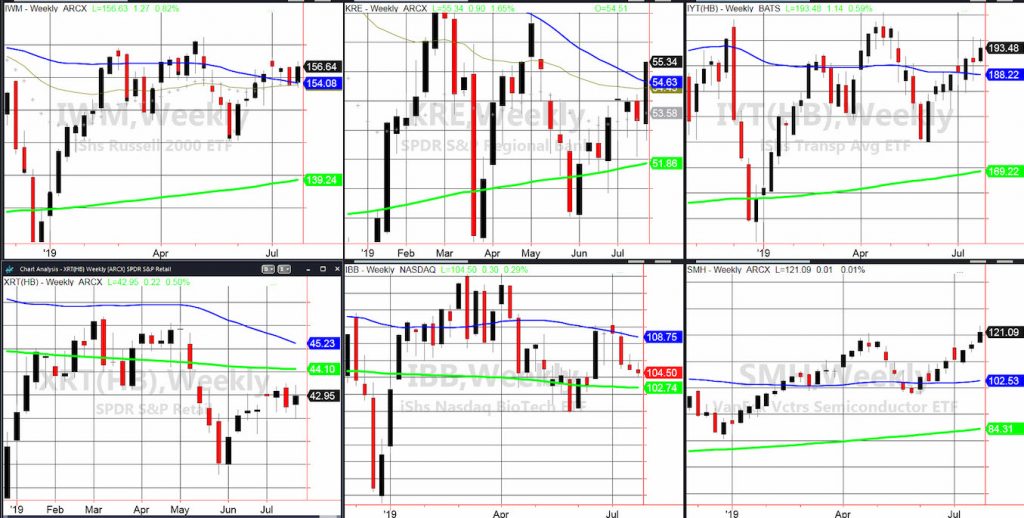
The most notable mover on Friday was the Regional Banks ETF (NYSEARCA: KRE). With the better than expected GDP number (2.1%), the anticipation that the Federal Reserve may not lower rates, or if they do, by only ¼%, helped this sector.
As I used this sector to determine whether the move in the stronger sectors would terminate, we can clearly see that KRE did its job to keep the other sectors in the game.
Since this is a weekly chart, we do want to see a second week close above the 50-WMA at 54.63.
The Russell 2000 ETF (NYSEARCA: IWM) also moved further away from the 50-WMA at 154.09. That puts the high from the week of July 5thor 158.03 in focus if the strength continues.
We must also take note that both KRE and IWM moved up, yet are still way below the SPY and QQQs, both of which made new all-time highs.
The other sector to look at is Transportation IYT. It had an inside week and the slope of the underlying 50-WMA remains negative. However, it held onto recent gains.
As far as the remaining three sectors, Biotechnology IBB is still in a bearish phase.
Retail XRT, may still see some money rotate into as the biggest reason for the gain in GDP was because of consumer spending.
XRT has yet to clear 43.15. It also trades below the 80-month moving average. Those are the points I will be watching.
Semiconductors SMH, having already done its job, took a rest.
No doubt, having 4 of the 6 sectors in bullish weekly phases is positive.
Will the other 2 sectors catch up or drag the other 4 down?
How can we know what’s happening in the market?
Watch the phases in all six Modern Family members.
S&P 500 (SPY) – 302.23 the ATH. 300.00 pivotal. Under 299.50 some trouble.
Russell 2000 (IWM) – 158.03 or bust.
Dow (DIA) – Inside day. 273.99 all-time high. 270.50 must hold.
Nasdaq (QQQ) – New ATH at 195.55. 193.40 now the pivotal support.
KRE (Regional Banks) – 56.75 next point of resistance with 54.62 key support.
SMH (Semiconductors) – ATH at 123.56. 120.71 now pivotal support. If breaks see 118.10 next.
IYT (Transportation) – 195.28-190.94 the range we will watch to see which way it breaks.
IBB (Biotechnology) – 105.42 the 50-DMA pivotal.
XRT (Retail) – 43.12 is my number to clear.
Twitter: @marketminute
The author may have a position in the mentioned securities at the time of publication. Any opinions expressed herein are solely those of the author, and do not in any way represent the views or opinions of any other person or entity.


 Trading at 23-Month Moving Average")


