Bonds have had one of the worst years in modern times and one of the fastest rates of interest rate rises.
The good news is the market has absorbed the bond’s performance.
A better risk-on environment is when the SPY outperforms the long bonds.
Same is true with junk bonds outperforming long bonds. Another indicator or risk on.
The yield curve remains inverted-or the potential recession indicator-has not to date caused a recession.
Hence talk of a soft landing.
Will yields tap out at 5.5-5.75%? Many think so.
However, higher for longer seems more likely.
Furthermore, Inflation is not quite done.
The PCE, due out this week, is at 4% not 2%
And just as it took from 2020 until spring 2022 to see inflation soar then peak, it is likely we will not see the impact on these rates until 2024 or even 2025.
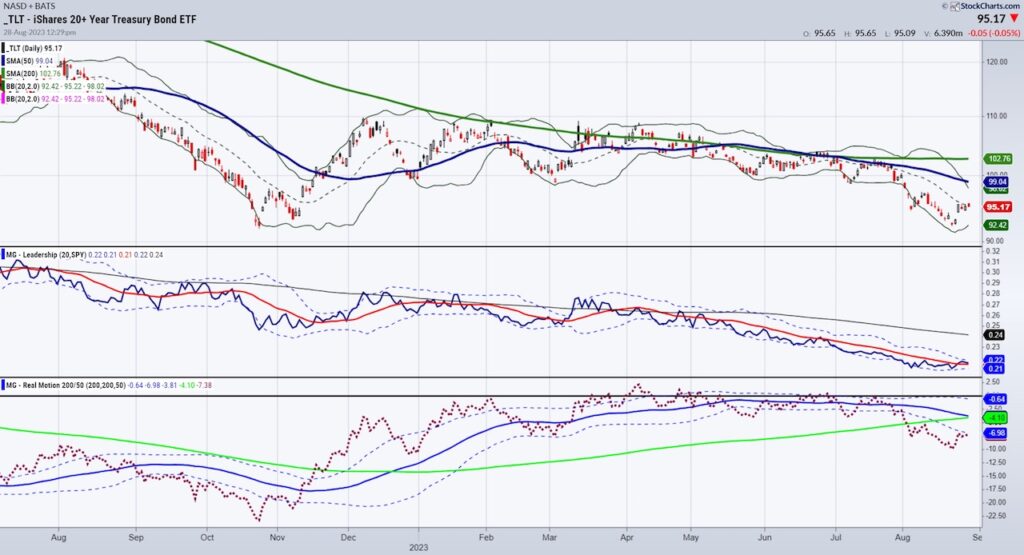
Talking technical, bonds do not look likely to rally from here (TLT).
However, we are watching the October 2022 lows carefully.
A potential double bottom exists if TLTs can clear back able 98.
A move under 95 though, points more to a retest and possible break of the low 91.85.
How does this impact small caps?
Small caps as measured by IWM are key for the fall and into 2024.
You can also look at SML S&P 600.
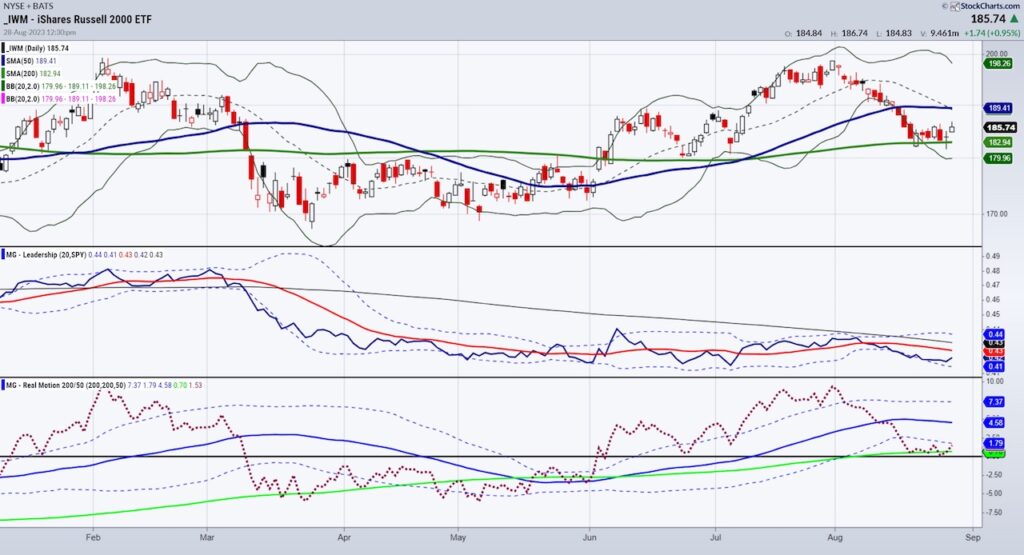
Over the weekend, we covered that the Russell 2000 IWM could be forming an inverted head and shoulders bottom going back from the start of 2023.
First though, it must hold 180 and clear 190. No small task.
Small caps are related to commercial real estate, so that is a caveat.
Why could small caps do well?
The Government has spent a lot of money on US manufacturing-and the Dallas fed index fell less than expected.
In the US quest for more independence on goods, we must look to costs and labor for the trend to sustain.
It must be noted though, that prices and wages paid soared.
The IWM chart shows a lack of leadership thus far against the SPY.
The Real Motion Indicator has no real divergence from price.
Nonetheless, IWM needs more everything-more rally, more leadership, and more momentum.
Our small caps quant model has done well this year, buying companies with earnings growth.
The basket is an interesting combination of semiconductor companies, home building and beauty staples.
Twitter: @marketminute
The author may have a position in mentioned securities at the time of publication. Any opinions expressed herein are solely those of the author and do not represent the views or opinions of any other person or entity.


