The iShares MSCI Hong Kong ETF (NYSEARCA: EWH) made new 52 week highs and is attempting to break out.
Investors looking for investment exposure to China and the far east should keep an eye on the Hong Kong ETF (EWH).
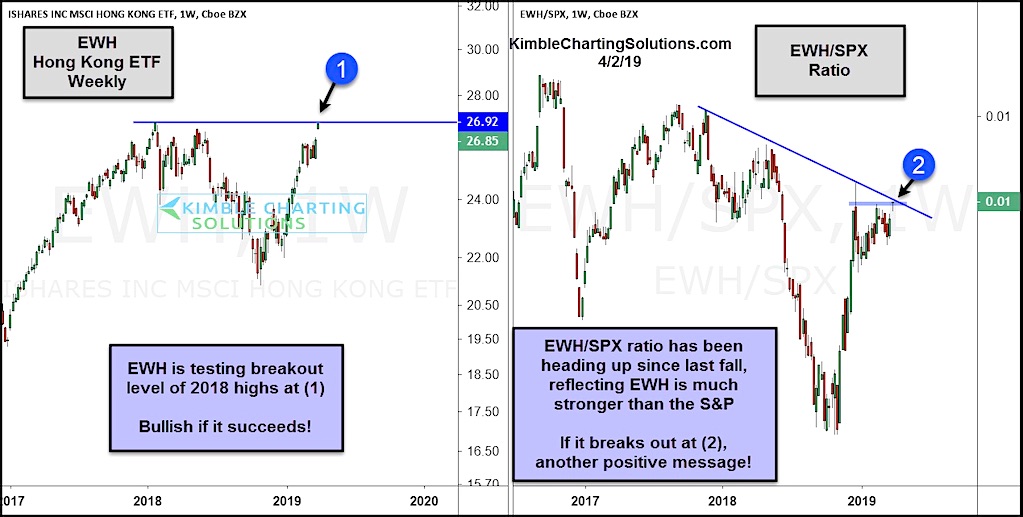
In today’s chart 2-pack, we look at a weekly chart of EWH, as well as a relative strength chart of EWH vs the S&P 500 (SPX).
My first take away is that it’s pretty clear that Hong Kong stocks have been strong in 2019.
In each chart, the price action has risen to test a key breakout resistance line (see points 1 and 2). Bulls would love to see a surge higher here.
A breakout (that sticks) at this juncture would send a positive message to EWH investors.
Hong Kong ETF Chart
Note that KimbleCharting is offering a 2 week Free trial to See It Market readers. Just send me an email to services@kimblechartingsolutions.com for details to get set up.
Twitter: @KimbleCharting
Any opinions expressed herein are solely those of the author, and do not in any way represent the views or opinions of any other person or entity.

: Showing Some Signs of Emerging Strength")

