Summary: The rising price of copper is probably a good sign that the global economy is non-recessionary. When copper has risen, so has GDP. But the converse is not true: falling copper prices have not signaled a slump in the economy.
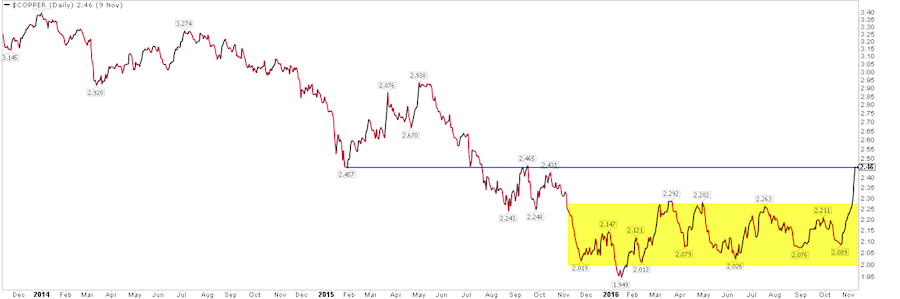
Copper prices are surging. The metal’s price is up over 20% in 2016. Current prices are the highest in about 18 months. Let’s look at this in light of the GDP-Copper Prices correlation throughout history.
Copper is often called the metal with a PhD, as changes in copper prices are regarded as a smart tell on the economy. On the surface, this seems to be true.
Going back 50 years, when the global economy has risen (year-over-year basis), the price of copper has also risen y-o-y.
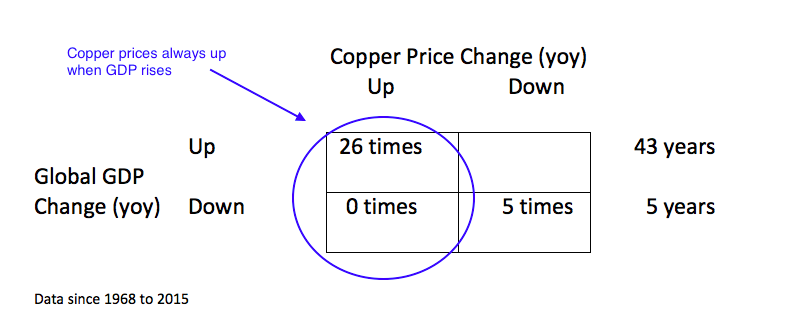
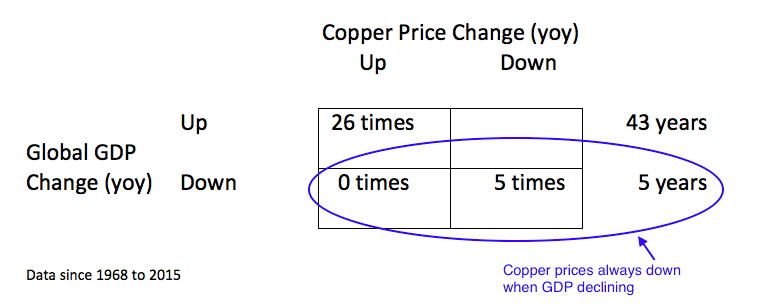
And when the global economy has fallen, the price of copper has also fallen.
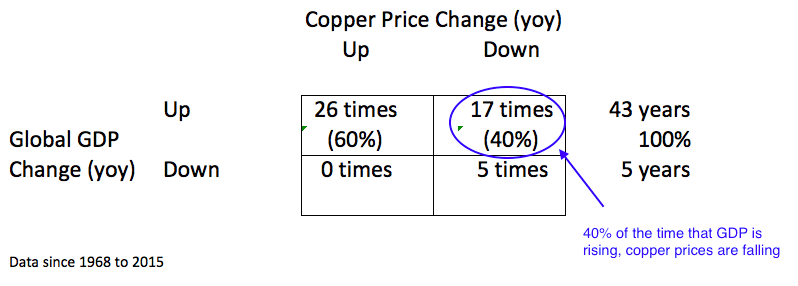
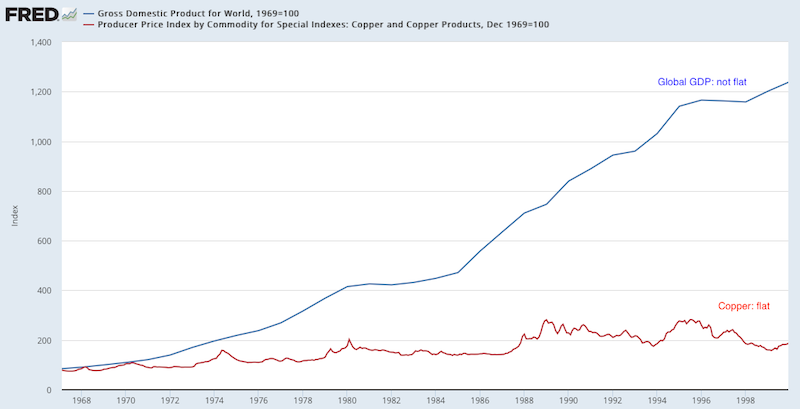
On closer inspection, however, copper’s predictive abilities are a bit less sublime. How so? Rising global GDP isn’t just associated with rising copper prices, it’s also associated with falling copper prices. Global GDP is almost always rising. In the past 50 years, it has been rising 90% of the time. During that time, the price of copper has been rising and falling in nearly equal measure.
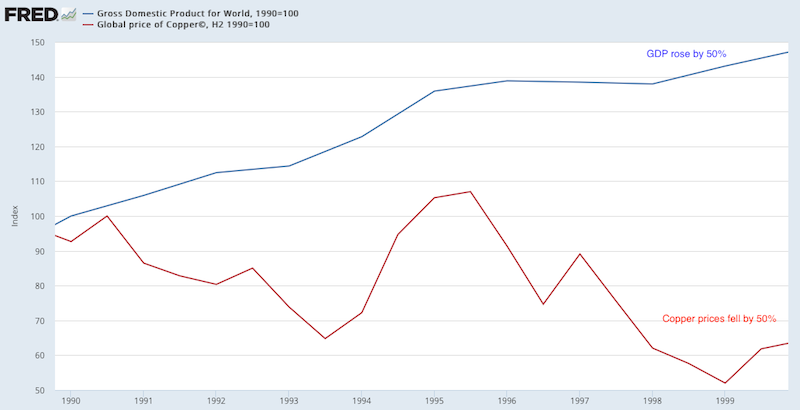
Consider this. The price of copper fell by half during the 1990s. During this time, global GDP grew 50%. Nobody looking at the relationship between these two in real time was impressed by copper’s PhD.
In the prior 3 decades, the global economy increased by a factor of 12. The price of copper increased by less than a factor of 1.
The notion that copper is a valuable tell on the global economy mostly comes from the 2000s. Global GDP rose and the price of copper skyrocketed, primarily as consumption in developing nations exploded. As well, both fell in 2009 and then both rose in 2010 and 2011.
Since then, however, these two have gone in opposite directions. Copper prices fell almost 50% between 2011 and the end of 2015.
The relationship between the S&P 500 (blue line and arrows) and copper (red) is even less helpful.

The main problem with copper’s PhD is that copper supply can increase faster than demand, so even if the economy is growing, the price of copper will fall. Inventories can also distort prices for prolonged periods of time. There is also the affect of product substitution and production efficiencies.
For investors, the rising price of copper is probably a good sign that the global economy is non-recessionary. Again, when copper has risen, so has GDP. But the converse is not true: falling copper prices have not signaled a slump in the economy.
Thanks for reading.
Twitter: @ukarlewitz
Read more from Urban’s Fat Pitch Blog
Any opinions expressed herein are solely those of the author, and do not in any way represent the views or opinions of any other person or entity.


 Testing Important Price Support")
")
