Commodity prices have skyrocketed over the past few years, but today we put the move higher into perspective.
And we do this by looking at a long-term “monthly” chart of the Thomson Reuters Equal Weight Commodity Index.
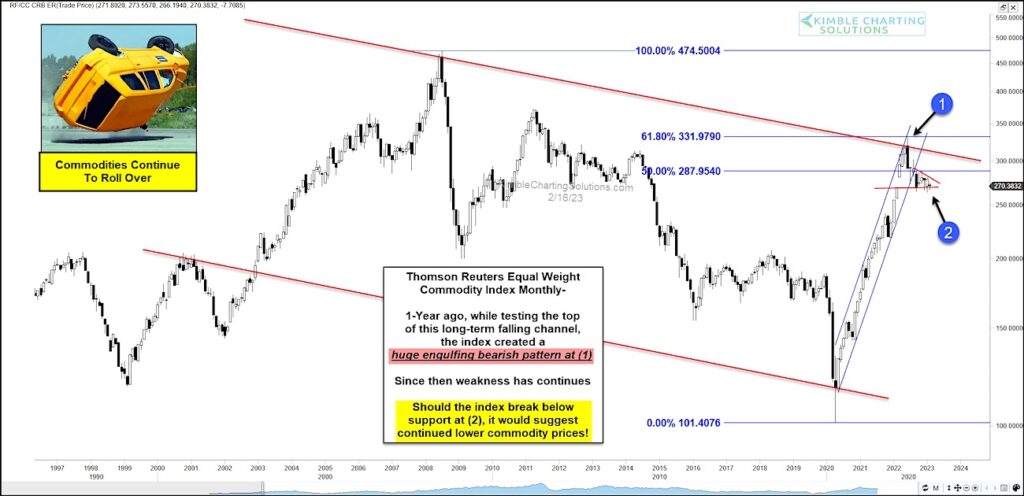
As you can see, commodities have been trading within a wide falling price channel. The big rally from 2020 to 2022 saw the Equal Weight Commodity Index go from the bottom of the channel to the top at (1). That top was also marked by the 61.8% Fibonacci retracement.
Commodities have now declined nearly 20% from roughly one year ago and are testing important near-term price support at (2). If this index breaks below support here it could mean a bigger decline for commodity prices is underway. Stay tuned!
Equal Weight Commodities Index “monthly” Chart
Note that KimbleCharting is offering a 2 week Free trial to See It Market readers. Just send me an email to services@kimblechartingsolutions.com for details to get set up.
Twitter: @KimbleCharting
Any opinions expressed herein are solely those of the author, and do not in any way represent the views or opinions of any other person or entity.

: Worrisome to Broader Market?")
