FED FLIPS AND CHINA DEAL LOOKING MORE LIKELY
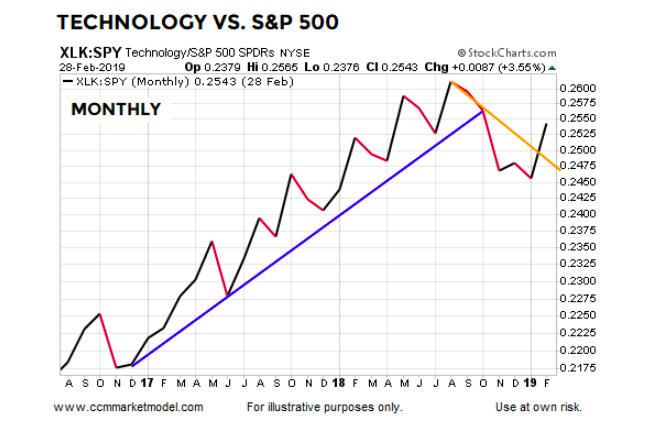
The monthly chart below shows the performance of technology stocks (XLK) relative to the S&P 500 (SPY). After the 2016 U.S. presidential election, growth-oriented tech emerged as a clear market leader.
Concerns about Fed policy and ongoing trade friction with China helped drive a shift toward more defensive sectors in Q4 2018 (see break of upward-sloping blue trendline). In February 2019, the Fed’s reversal on several key issues and more encouraging news from trade negotiations brought increased buying conviction to the tech sector.
Tech stocks outpaced the S&P 500 by 3.55% in February and appear to be making an attempt at recapturing a market-leadership position (see break of downward-sloping orange trendline).
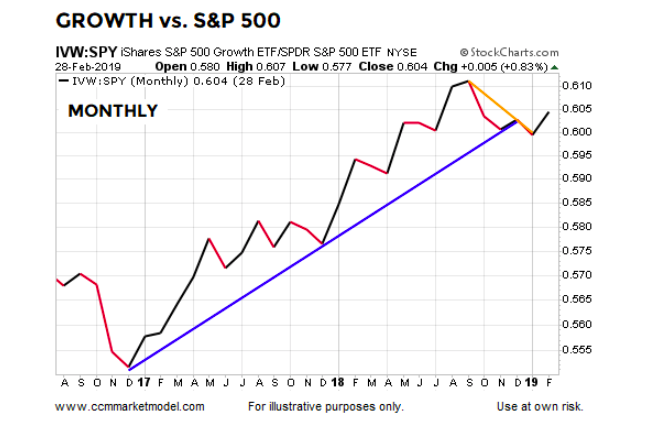
Additional clarity on the Fed’s balance sheet (QT) game plan helped ignite a similar attempt at a bullish turn on the growth (IVW) vs. S&P 500 chart below. In February, growth stocks outperformed the market by 0.83%.
LONGER-TERM STUDIES ALSO LEAVE BULLISH DOOR OPEN
This week’s stock market video provides updates to numerous studies (bullish and bearish) covered in recent months and provides some “what to look for” clues for both bulls and bears.
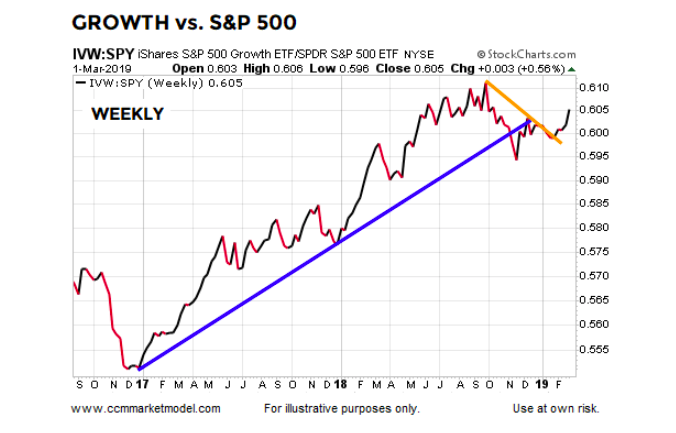
WEEKLY PERSPECTIVE ALSO ENCOURAGING
You can make an argument that last week’s outperformance by growth and tech stocks was based on increasing optimism that China and the United States could be close to resolving some of their major trade-related differences. On Sunday afternoon, The Wall Street Journal reported:
“China and the U.S. are in the final stage of completing a trade deal, with Beijing offering to lower tariffs and other restrictions on American farm, chemical, auto and other products and Washington considering removing most, if not all, sanctions levied against Chinese products since last year.”
Last week, growth stocks beat the S&P 500 by 0.56%. More defensive-oriented utilities (XLU) lagged by 0.32%; consumer staples lagged by 0.80%.
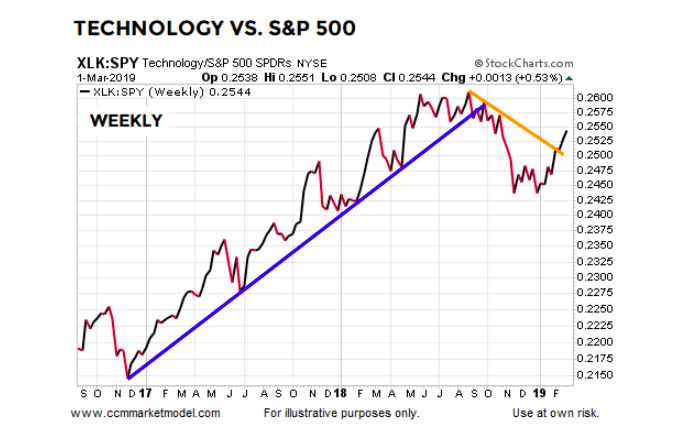
Over the past five sessions, the technology sector outperformed by 0.53%, resulting in a better-looking weekly XLK vs. SPY chart.
MORAL OF THE STORY
Technology and growth stocks significantly outperformed the market following the 2016 election; then lagged primarily due to Fed/China-related issues. It is possible these sectors are in the early stages of another period of leadership.
Until an agreement is formally in place, uncertainty remains on the US/China front, but recent market action speaks to favorable odds. On the Fed front, a full about-face has taken place.
Therefore, it is possible the market’s two biggest concerns have been addressed sufficiently to allow a resumption of the prior growth-leadership trends.
Given an area of overhead resistance has not yet been cleared and lingering concerns remain about global growth, it is also possible the term “failed breakout” will be utilized in coming weeks. Any adjustments to our allocations will be based on the latest facts rather than a forecast of things that may or may not take place in the weeks ahead.
If recent constructive shifts continue, the data may call for a reduction on the conservative side of the portfolio and ongoing additions to the growth side. All TBD.
Twitter: @CiovaccoCapital
The author or his clients may hold positions in mentioned securities at the time of publication. Any opinions expressed herein are solely those of the author, and do not in any way represent the views or opinions of any other person or entity.


 Rolling Over At Key Fibonacci Level?")
