If one believes in mean reversion, then it is likely CAPE will regress to its historical average ratio (16.7) within the next five years. If we further assume the price of the S&P 500 does not change, we can easily solve for expected earnings growth. Given those assumptions, the required annualized earnings growth for the next five years is nearly 11% at current valuations.
In other words, the S&P 500 price would be unchanged over the next five years if corporate earnings grow 11% annually and CAPE regresses to its long-term average.
However, if we assume investors expect the S&P 500 price to grow 5% a year as it has averaged this century, then earnings must increase 16.50% annually to offset the reversion to the mean of CAPE. If we take a more conservative stance and assume that CAPE will remain at one standard deviation above average at 23.35 and the S&P 500 price will grow 5% annually, earnings must grow at an annualized rate of 4.50%.
A scenario in which earnings grow annually at 4.50% may seem reasonable, but it is relatively optimistic when put in context with previous growth trends and economic impediments. Consider that over the last three, five and ten years, S&P 500 earnings have grown at annualized rates of -0.48%, 2.34%, and 1.80%, respectively. It is worth noting that the three- and five-year periods do not include a recession. Expecting that streak to continue five more years fails to incorporate reasonable recession probabilities into the analysis.
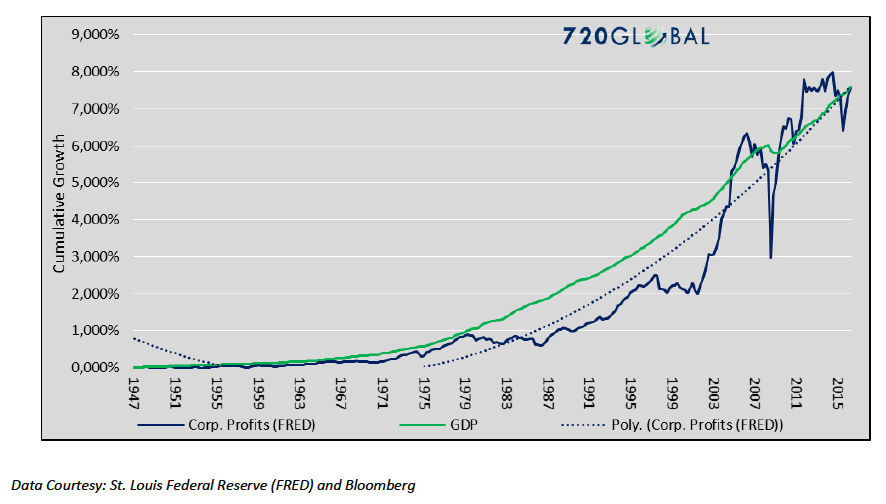
To put additional perspective on expected earnings growth, we analyze the nation’s economic growth rate. Since 1947, real GDP and corporate earnings have grown at nearly identical long-term rates. The graph below charts the cumulative growth of earnings and GDP over this period. Note that, while the growth rates vary wildly, they have been well-correlated over the longer-term as witnessed by comparing the less volatile earnings polynomial trend line (blue dotted line) with GDP (green line).
The graph below aids in forecasting earnings growth by highlighting the secular trend of GDP growth since 1950.
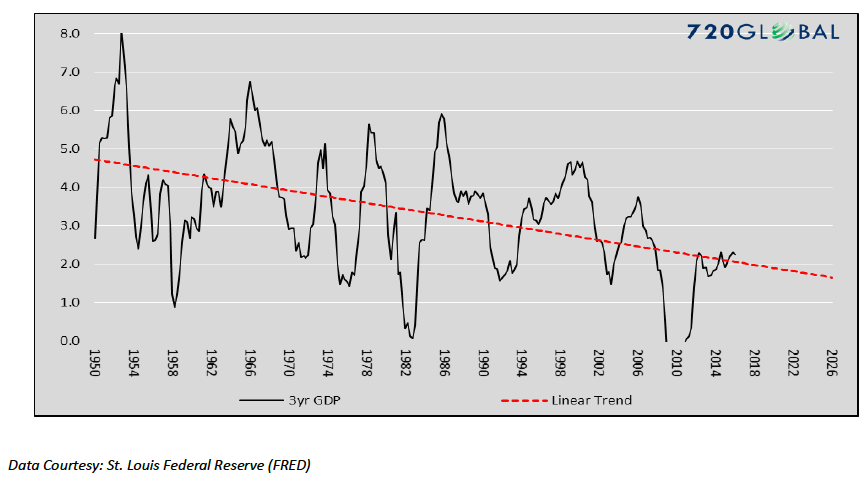
The trend was confirmed by Janet Yellen, who on January 18, 2017, stated that the long-run GDP growth rate is expected to fall under 2%. Based on the GDP trend line and the correlation of earnings to GDP expectations, one should assume earnings growth will follow GDP and be 3% or less.
The future growth rate assumption mentioned above is not solely a function of extrapolation from previous trends. It is truly arrived at with a thorough understanding of the economy’s structural impediments – debt, demographics, and productivity as we have noted in numerous prior articles.
Scenario Analysis
At this point, we have presented you with historical earnings trends and a way to estimate future earnings growth. Additionally, we provided a long history of the price to earnings ratio and the statistically significant distribution it has followed. With this data in mind, we present the table below which allows you to forecast stock price changes based on future P/E ratios and earnings growth estimates. Note the three colored boxes reflect what we consider to be optimistic, fair and pessimistic estimates. Here are the simple steps to evaluate forward returns:
- Select the CAPE ratio you expect to see in 2022. At the top of the table are six options ranging from 10.1 to 28.1 (current level). The range is based on standard deviations as shown above each P/E level.
- Select the expected annualized earnings growth for the next 5
- Find the intersection of your CAPE and earnings growth estimates. The number at the intersection is the expected annualized price return for the S&P 500 for the next five years. As a quick example, a projected CAPE of 20.0 and 3% earnings growth will result in an expected annual return of -2.57% for each of the next five years.
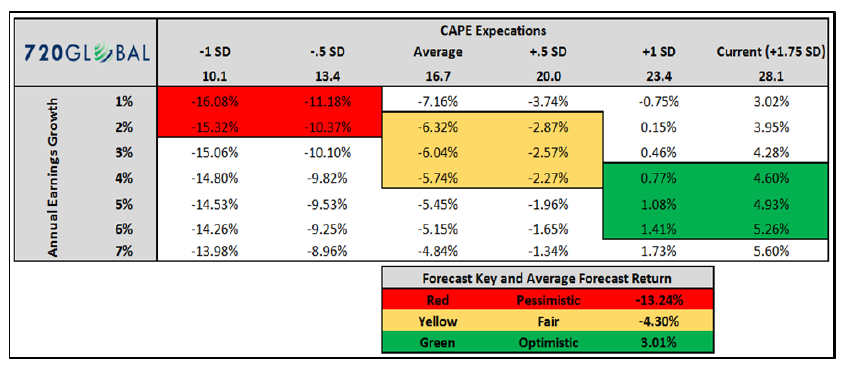
As illustrated in the table, the risk/reward profile is very unbecoming unless you believe CAPE will stay grossly elevated and earnings will grow significantly more than they have over the past ten years. A relatively riskless strategy, whereby one buys and holds to maturity a five-year U.S. Treasury bond yielding 1.98%, beats all but the most optimistic scenarios highlighted above.
Summary
Many investors believe that the initiatives of the new administration will provide an economic spark generating economic growth and increasing corporate earnings. Although confidence is a cheap form of stimulus, reality is that the structural headwinds the economy faces are brisk. Given the historically high valuations and poor risk/reward ratio, we prefer to let the market prove us wrong.
One final note for consideration; since January 1, 2012, the S&P 500 has increased 75%, while earnings have increased 2%. In other words, for all intents and purposes, the entire rally from 2012 is a function of multiple expansion and is in no way supported by fundamentals. For investors who hold mean reversion as an important guiding principle, it is not unrealistic to expect the CAPE multiple to regress back towards its historical average. Indeed, it is entirely expected.
We leave you with the article’s opening quote as it is such an important concept to grasp: “Never ever lose sight of long term relationships”.
Note that my firm will soon be offering “The Unseen”, a subscription-based publication similar to what has been offered at no cost over the past year and a half. Stay tuned.
Twitter: @michaellebowitz
Any opinions expressed herein are solely those of the author, and do not in any way represent the views or opinions of any other person or entity.

: Showing Some Signs of Emerging Strength")
