Back in February I wrote a post that highlighted why Google stock (GOOGL) appeared to be near a top and/or forming a topping pattern. I highlighted a few price targets to watch along with some other price considerations.
Thus far, the overhead price levels have held. And Google stock appears to be in a “cautious” price area.
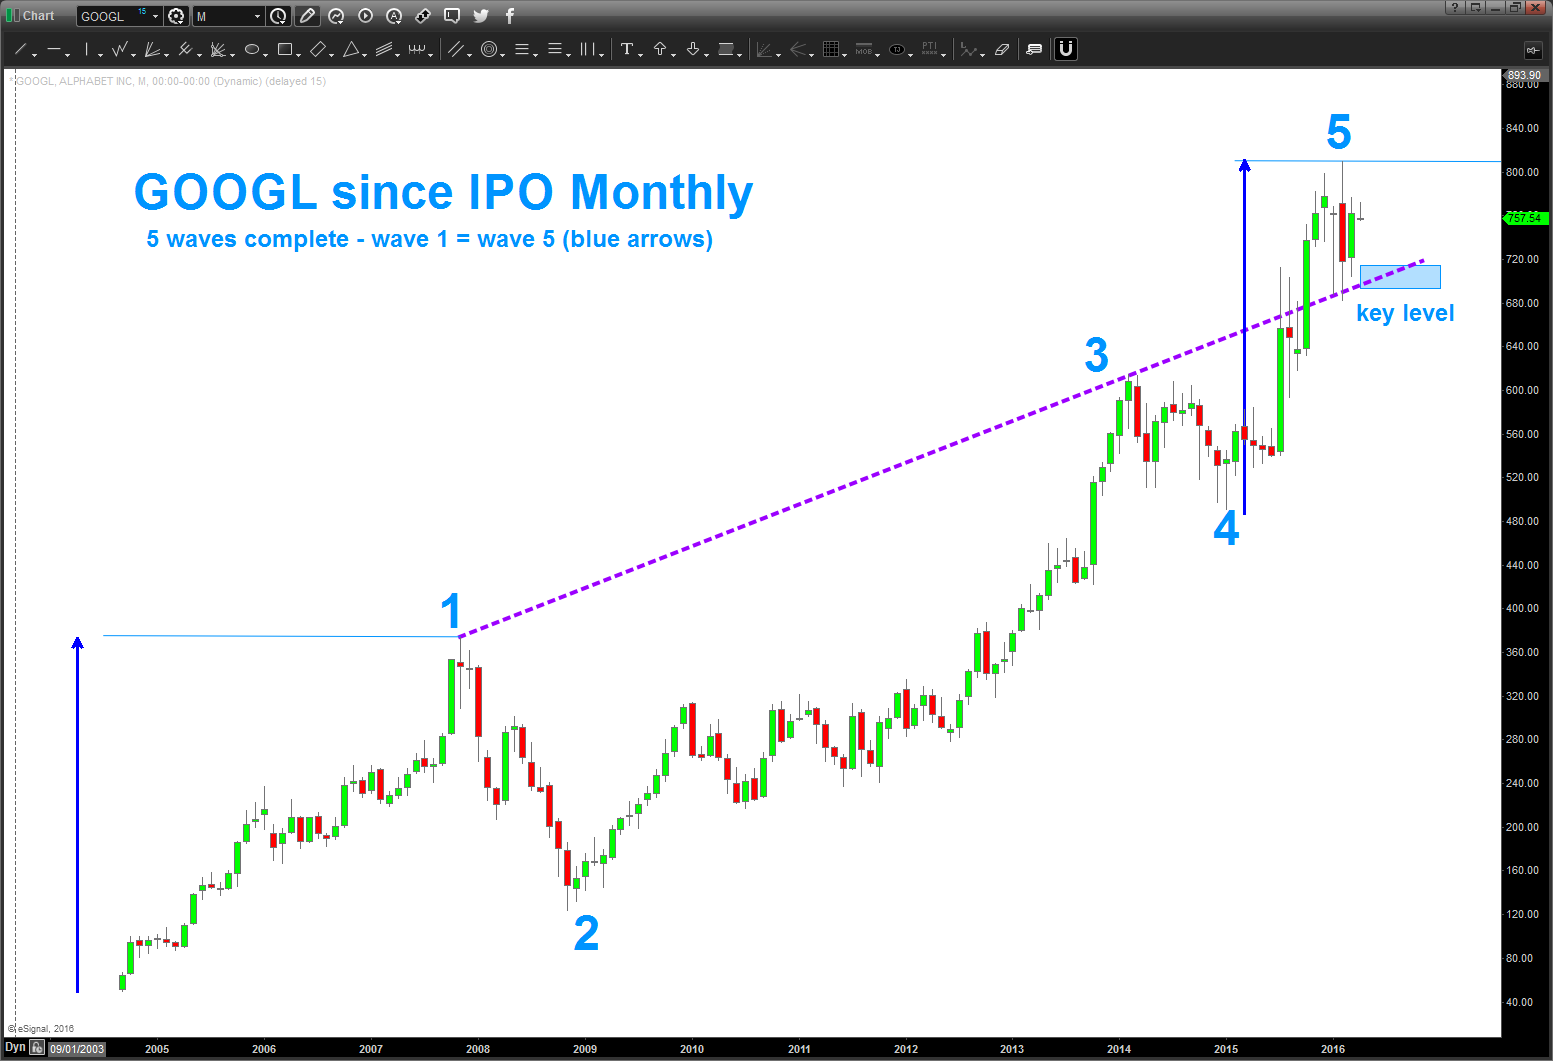
The chart below is a long-term monthly chart. You can see the potential wave count and distinct possibility that a top is in. In my prior post, I showed how my initial wave 5 price target had been hit.
Currently, I am watching the purple uptrend line around 690-710 to determine if a top is in. A WEEKLY close below the purple line would be a key break to the downside, in my opinion. On the flip side, any further strength to the upside by Google stock price may mean that wave 5 is extending – which obviously could happen.
That said, it’s clearly a time to remain conservative with this high flying tech stock.
Google Stock Chart – (Monthly)
Thanks for reading.
More from James: Visa (V) Stock Update: Divergences Concerning
Twitter: @BartsCharts
Author does not have a position in mentioned securities at the time of publication. Any opinions expressed herein are solely those of the author, and do not in any way represent the views or opinions of any other person or entity.
")

 Testing Important Price Support")
")
