Visa (V) has enjoyed quite a run since its IPO. The company has enjoyed a bevy of sector tailwinds and a strong broader market to boot. But some of that enthusiasm may be tested soon as Visa stock price looks to have formed a sell pattern.
In short, the stock is getting tired. Visa stock price is showing a near-term sell pattern within a broader, long-term negative divergence. So even if it thrusts higher, it will likely be on its last legs.
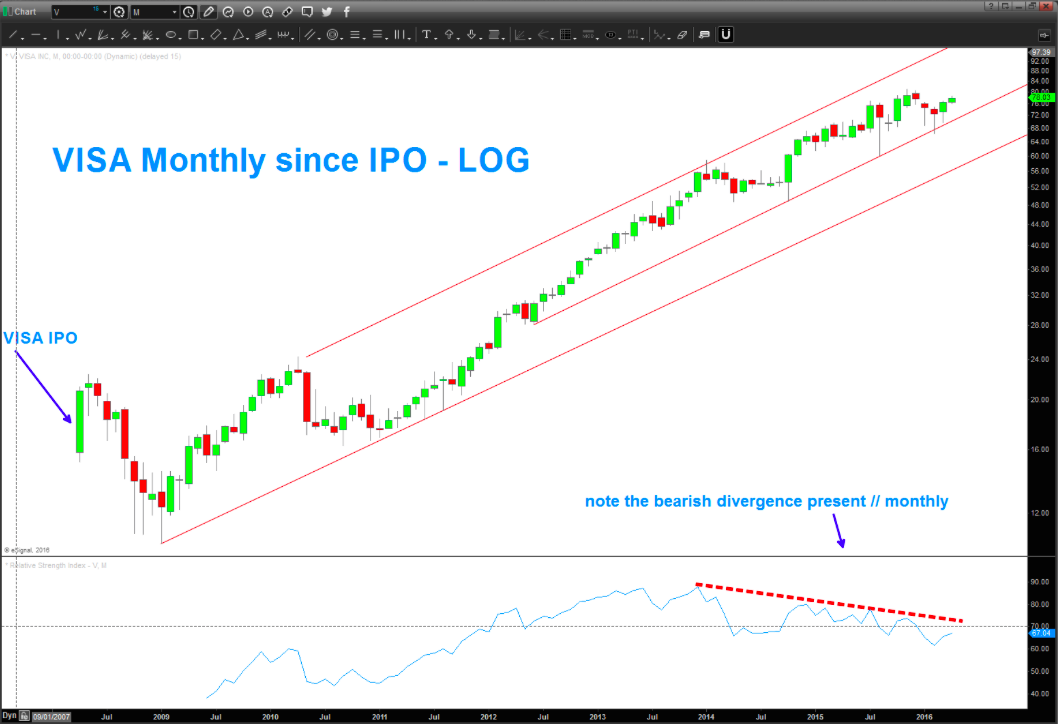
Below is the monthly log chart for Visa stock (V). The bearish divergence has been going on for some time (and, in truth, could continue a bit longer). The stock has a chance to go up to that upper trend line but the “long term” bearish divergence is concerning.
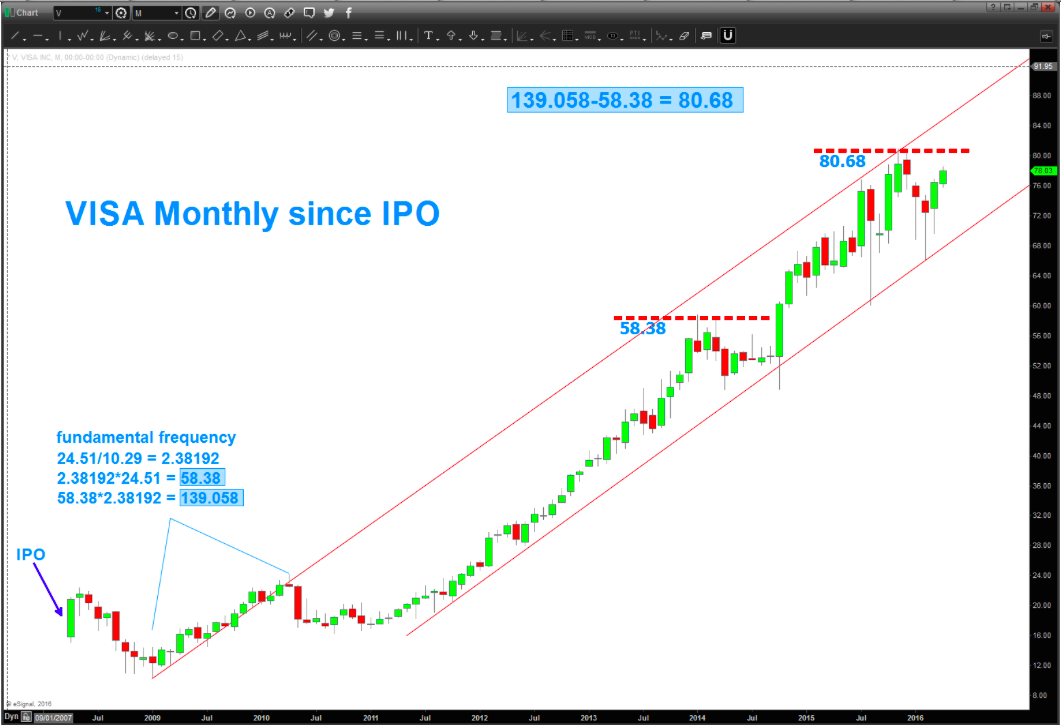
The chart below shows the fundamental frequency. If you want to figure it out, check out the blog Stock Cycles Forecast as Michael Jenkins is not only an amazing mentor but he’s a friend. He taught me this.
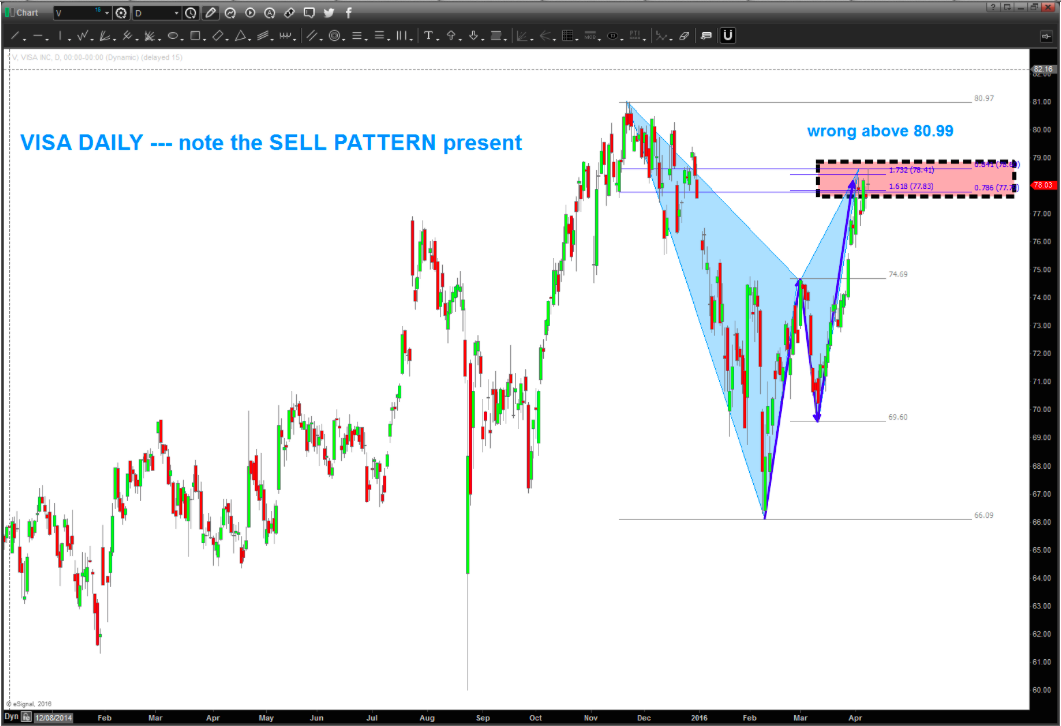
The next chart zooms in a bit and highlights the current “sell” pattern setup. There are never any guarantees, only probabilities. This is why traders look for risk/reward setups and use a stop to define risk.
Should this sell pattern “fail”, then higher price targets would likely be as follows.
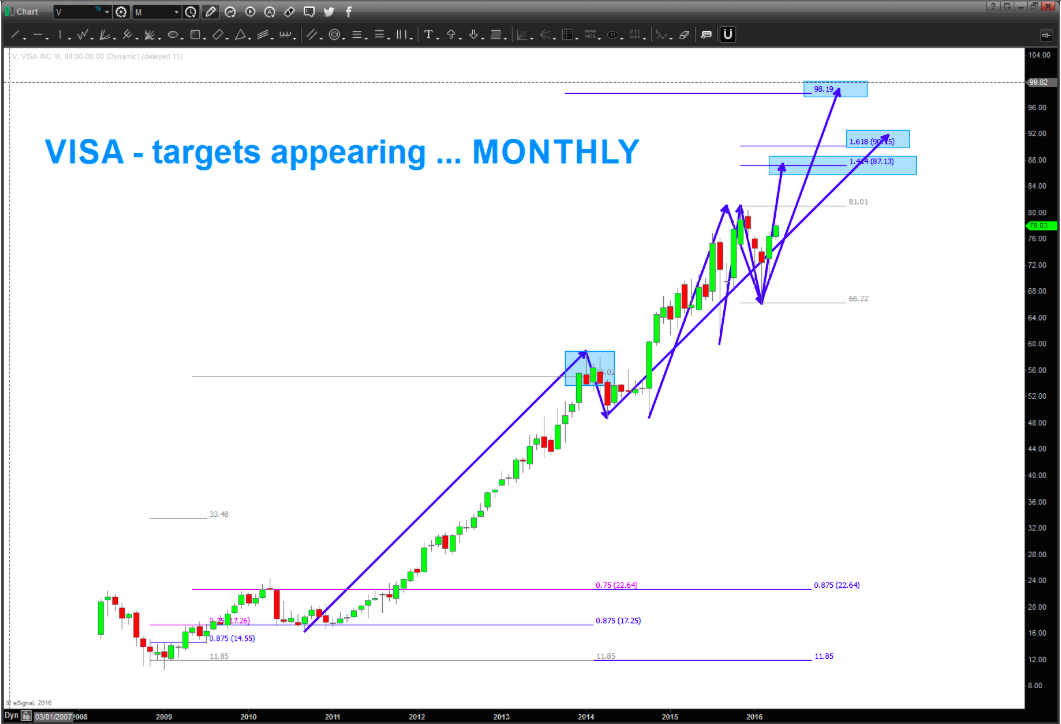
In summary, on the long term charts for Visa stock, the monthly bearish divergence coupled with the SELL PATTERN hitting currently, say caution is advised. If it breaks higher, it will likely be a last gasp within this move. I would be shocked if Visa can overcome the levels shown above … but that doesn’t mean anything. After all, it’s all just probability.
Thanks for reading.
More from Bart: Is The NYSE Composite Index Warning Of A Market Pullback?
Twitter: @BartsCharts
Author does not have a position in mentioned securities at the time of publication. Any opinions expressed herein are solely those of the author, and do not in any way represent the views or opinions of any other person or entity.
")


")
