Gold – US Dollar Ratio “Monthly” Price Chart
Gold has been red-hot of late, raising the hopes of precious metals bulls.
After several failed rallies, is Gold (NYSEARCA: GLD) finally ready to breakout?
One ratio that I like to follow to monitor precious metals is the Gold to US Dollar ratio.
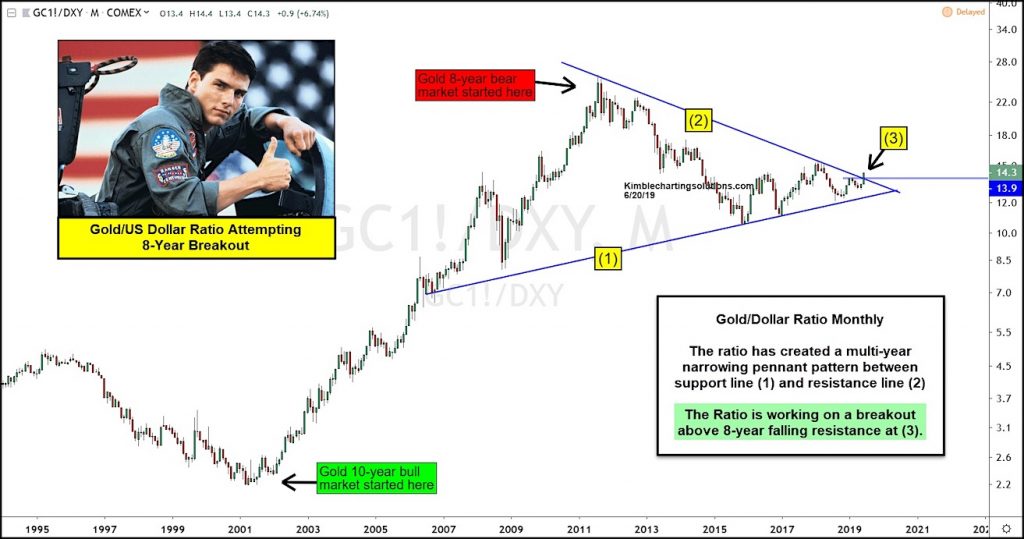
As you can see in the “monthly” bar chart above, the Gold / US Dollar ratio has been trading in a multi-year narrowing pennant pattern, with support at (1) and resistance at (2).
The ratio is working on a breakout above the 8-year falling resistance line at (3).
A breakout here would be huge for precious metals bulls… and could be the start of a larger rally if it holds.
Note that KimbleCharting is offering a 2 week Free trial to See It Market readers. Just send me an email to services@kimblechartingsolutions.com for details to get set up.
Twitter: @KimbleCharting
Any opinions expressed herein are solely those of the author, and do not in any way represent the views or opinions of any other person or entity.

: Worrisome to Broader Market?")

