Early this year, I postured that 2016 could see some mean reversion in the beaten and downtrodden stocks and sectors. Well, that has happened with a bang. And certainly, a bigger bang than I expected. This article takes a look at gold and the current gold rally from a technical basis. It also includes some intermarket analysis with respect to the U.S. Dollar as well as encompassing the always valuable Commitment of Trader’s (COT) data.
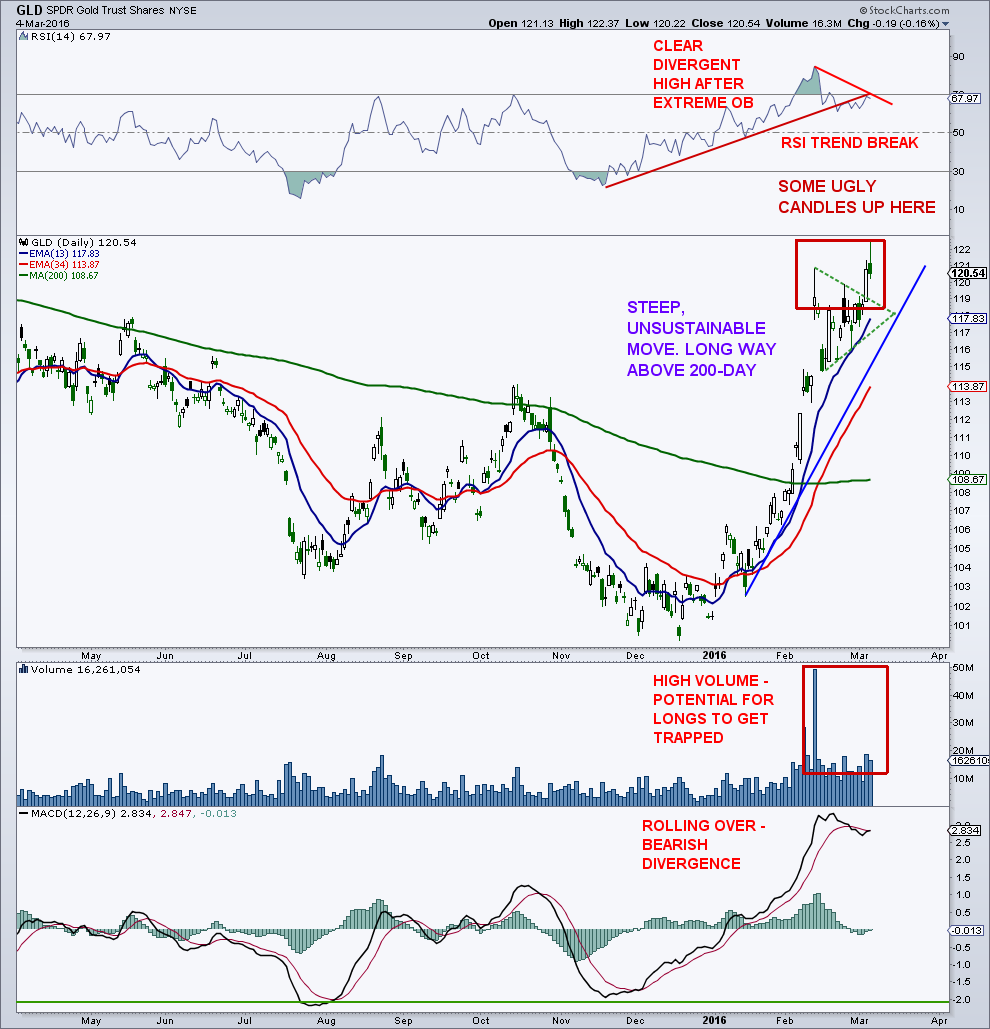
The iShares Gold Trust (GLD) broke out of a small triangle Thursday, moved to another recovery high Friday before printing a fairly nasty reversal.
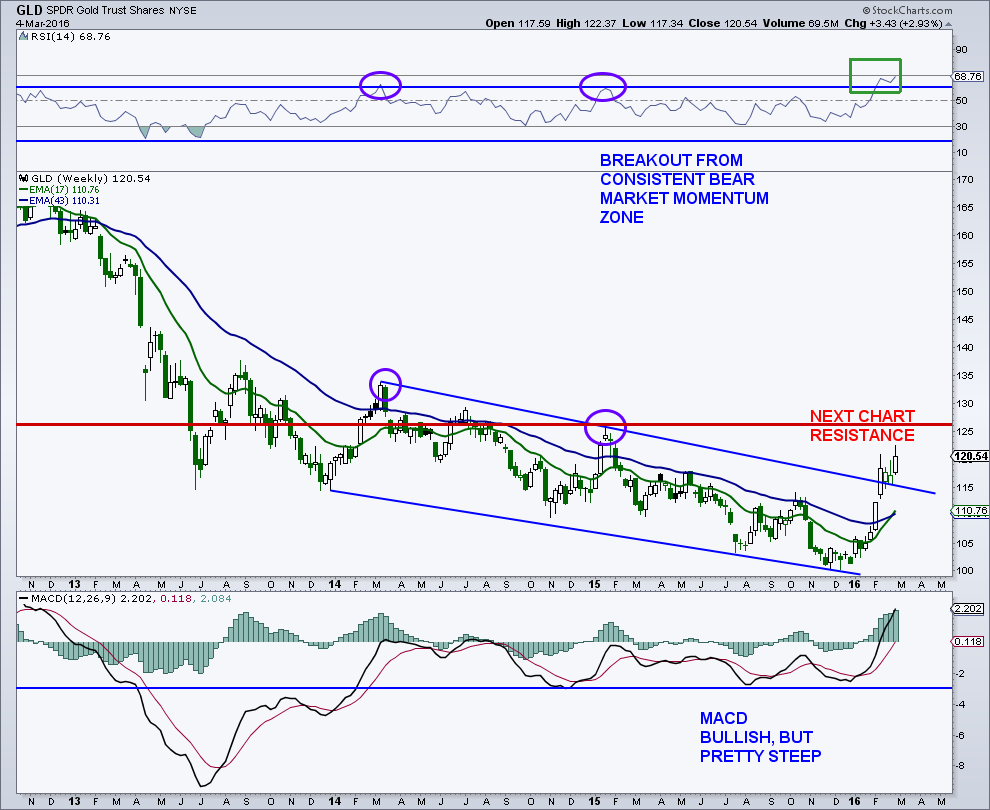
Due to the parabolic nature of this gold rally, and the unsustainable slope, there is bound to be a major pullback once this fire burns out. Remember, the brightest flames burn quickest. The next piece of chart resistance is up at 125, from the high back in January 2015. There is certainly a character change here with daily momentum cycling into extreme overbought territory and weekly momentum breaking out of its bear market zone. So longer-term, higher prices are probably in store.
It’s the near-term that I am worried about. It’s looking like the gold rally may be due for a pause/pullback here.
There has been an RSI trend break as well as clear momentum divergences on the daily chart. Volume has been high, so any breakdown will trap quite a few late-comers to the party.
The COT data has quickly reversed as the “smart money” commercial hedgers have rapidly reduced their net futures exposure to gold. In the past three months, hedgers have gone from a flat futures position to being net short by the widest margin since February 2015, which was not a very good time to be long gold. And guess what, small speculators (dumb money) have increased their net futures exposure to the yellow metal to the highest level since… February 2015. And that’s not all of it. Large speculators (dumb money) have also raised their gold exposure to the highest level since October 2015, and also not a good time to be long.
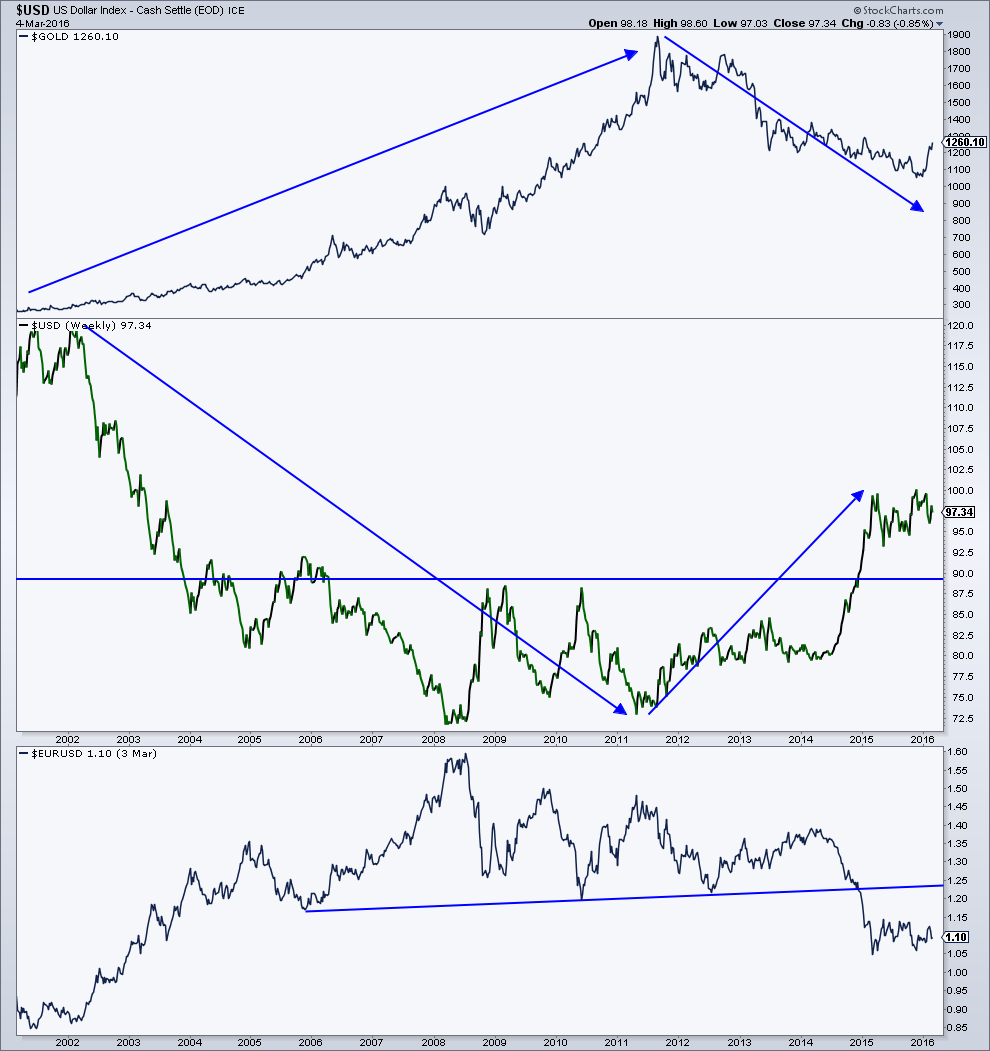
In my opinion, an analysis of gold prices should be accompanied by a look at the U.S. Dollar Index. It’s pretty clear from the chart below. Dollar down, gold up, greenback up, yellow metal down. Gold is a currency hedge. In other words, it protects investors from a loss of purchasing power when the greenie is in a correction or bear market. An inflation hedge? I don’t really think there has been a lot of inflation to talk about during this time period. However, a falling dollar can create inflation as it reduces our purchasing power and at the same time, stimulates the export side of the U.S. economy.
Over the past year, the US Dollar has been consolidating it’s large gains seen in 2014 and early 2015. This does not look like a top, but a bullish consolidation. Obviously, the resolution of this sideways movement will be pivotal for the performance of gold prices. The largest component of the U.S. Dollar Index is the Euro (around 60% I think). Does the Euro chart really look bullish? I see a breakdown from a complex head-and-shoulders.
Since March 2015, the COT data has been slowly getting more bullish for the dollar as commercials have been increasing their futures exposure to the greenback while large and small speculators have been decreasing their dollar exposure. Based on history, this probably has further to go before turning outright bullish on the dollar. This suggests more chop for the dollar within the context of the current price consolidation.
For now, I think risk is elevated for gold and that this gold rally may be getting near an end so some caution is advised. I believe a better entry point for new longs will present itself in the next couple of months. Gold may be in a cyclical bull market here, but unless the greenback breaks down big time, I really doubt a new secular bull market has started.
You can contact me at arbetermark@gmail.com for premium newsletter inquiries.
Read more from Mark: “S&P 500 Weekly Update: Why SPX 2000 Is So Important“
Twitter: @MarkArbeter
The author does not have a position in the mentioned securities at the time of publication. Any opinions expressed herein are solely those of the author, and do not in any way represent the views or opinions of any other person or entity.

: Showing Some Signs of Emerging Strength")

