Gold prices have been on a tear this year. But the yellow metal is presently encountering a potential Gold price resistance stemming from the 2011 highs. Specifically, we are looking at the popular SPDR Gold Shares ETN (NYSEARCA:GLD).
Following more weak U.S. economic data on Friday, the U.S. Dollar sold off and, as it often does in response, the price of gold spiked higher. This is nothing new for the yellow metal as it has been on an almost Michael Phelps-like pace in 2016, rallying some 30%.
However, no matter how strong the trend, there will always be some hurdles to overcome. Presently, Gold (NYSEARCA:GLD) may be facing just such a hurdle.
After jumping well over a percent to start the day Friday, gains in the popular GLD steadily leaked before turning negative. Why the reversal? The dollar is off of its lows, but still down on the day so it cannot take all of the blame.
The truth, as we see it, is that sometimes prices just run into a technical obstacle on the chart that serves as resistance. It doesn’t have to be more complicated than that. In this instance, the obstacle we find is the Down trendline (on a linear scale) starting at the 2011 highs and connecting the October 2012 highs. Extending that trendline to the present places it at approximately 130. Today’s high before the pullback was 129.26.
Gold ETN (GLD) Chart – Gold price resistance in play?
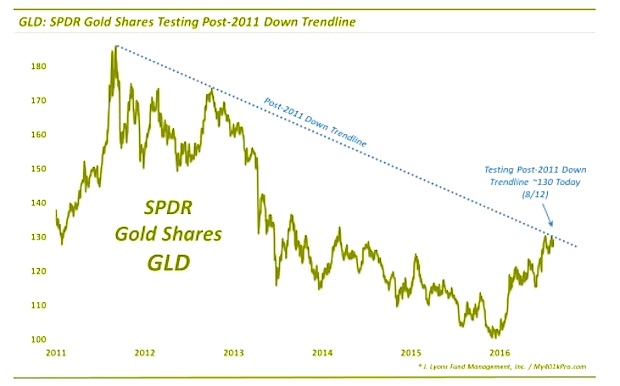
The bad news is that this trendline should serve as stiff resistance for the time being, absent a Simone Biles-like vault over the line. The good news is that the GLD has already twice tested the trendline, in early July and early August. These tests should have served to weaken the trendline somewhat. And the resilience on the part of the metal in avoiding a deeper pullback so far suggests that an eventual vault over the trendline should be forthcoming at some point.
When that happens (assuming it does), we don’t know. However, this post-2011 Down trendline looks to be the line to focus on at the moment in determining the direction for gold prices.
Thanks for reading.
Twitter: @JLyonsFundMgmt
Read more from Dana’s Tumblr Blog
Author may have positions in mentioned securities at the time of publication. Any opinions expressed herein are solely those of the author, and do not in any way represent the views or opinions of any other person or entity.


: Showing Some Signs of Emerging Strength")
