A month ago, I wrote an article that questioned “Is Gold Emerging From Hibernation?” I though I’d provide a brief update today.
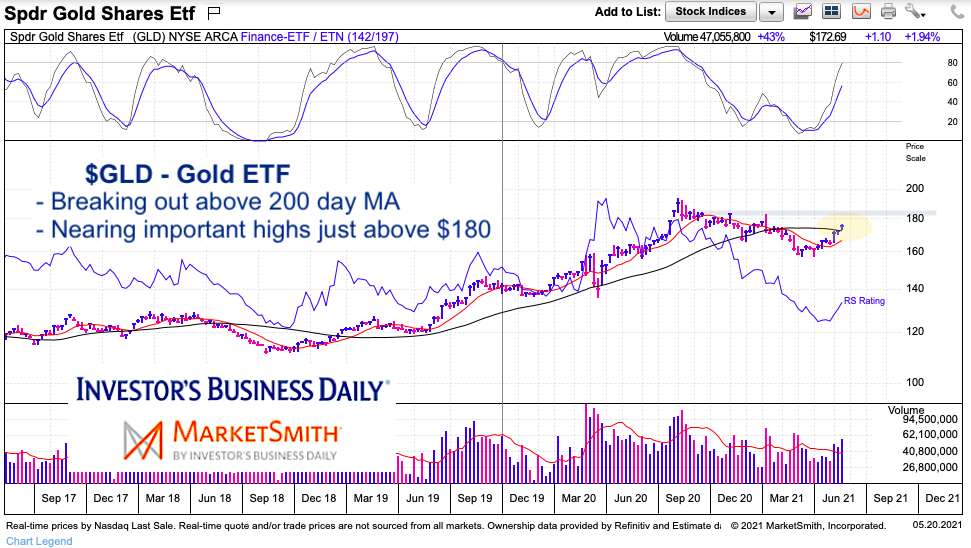
Since that article, the Gold ETF has risen from about 5 percent and pushed through its 200 day moving average. This is constructive and keeps the near-term trend bullish for Gold. See chart below.
There is still formidable overhead resistance at the recent highs formed this January and March (near $182-183), as well as the highs from August 2020. Gold needs to breakout over one to get to the other.
For now, we could see gold touch up near $180, retrace and test the 200 day MA once more… and, if successful, rally higher and breakout to retest the 2020 highs. Now, that is the technician in me… but in reality, gold could simply rally unabated to the 2020 highs if it breaks through the January/March highs like butter. We’ll see.
Note that the following MarketSmith charts are built with Investors Business Daily’s product suite.
I am an Investors Business Daily (IBD) partner and promote the use of their products. The entire platform offers a good mix of technical and fundamental data and education.
$GLD Gold ETF “weekly” Chart
Twitter: @andrewnyquist
The author may have a position in mentioned securities at the time of publication. Any opinions expressed herein are solely those of the author, and do not in any way represent the views or opinions of any other person or entity.
: Creating Bullish Divergence?")


 and Semiconductors (SMH): Concerning Price Pattern?")


