A month ago we published monthly and weekly charts showing the SPDR GLD Shares ETF NYSEARCA: GLD as being near the end of its five-year ascent.
That is still our view, although the price of Gold has overshot our target resistance zones.
This brief update shows where things stand on the weekly and daily charting time frames.
Both GLD and gold futures have the look of a blow-off top.
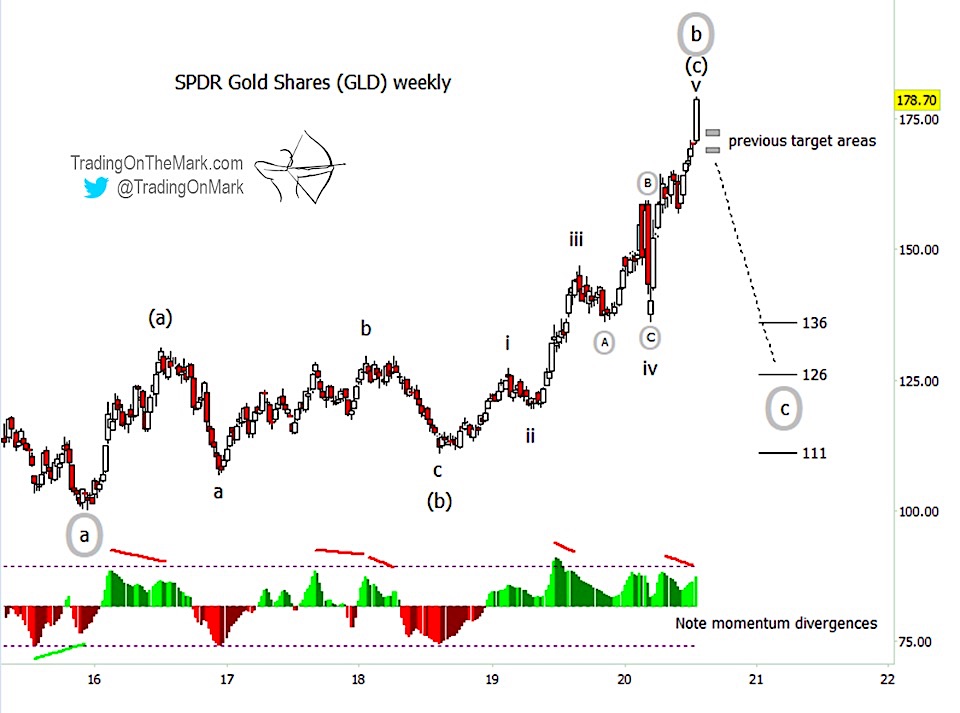
Our updated weekly chart shows slightly revised long-term support targets if a reversal kicks in soon.
The structure of our main scenario Elliott wave count at that scale remains the same. However, we have added some notations on the momentum indicator showing important price/momentum divergences that have preceded reversals and pullbacks during the past five years.
One such divergence is taking place right now.
The next proximate price resistance zone is near 181-182. This is based on Fibonacci relationships among the sub-waves that are visible on a daily chart.
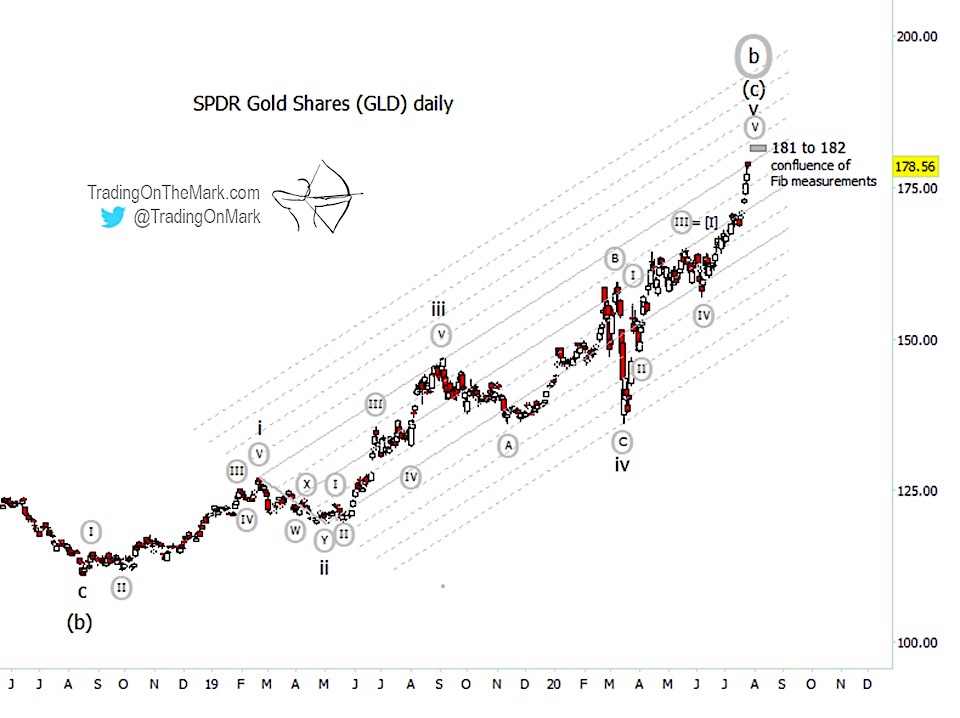
The trend line connecting waves i and iii put a cap on Thursday’s price action, but the Gold ETF (GLD) was able to climb over the line on Friday. In terms of geometry and wave counts, the ascent should be treated as complete. Blow-off tops are driven by un-savvy traders’ fears of missing out on a big move, and we expect those traders will be sorely disappointed in August and beyond.
Visit our website for more charts, and follow Trading On The Mark for updates and special offers.
Twitter: @TradingOnMark
The authors may have a position in the mentioned securities at the time of publication. Any opinions expressed herein are solely those of the author, and do not in any way represent the views or opinions of any other person or entity.


: Showing Some Signs of Emerging Strength")
