In these times it’s probably wise to have a toehold in inflation-protected assets, but if you are watching metals with a trader’s eye, gold prices have reached an area that could produce a substantial pullback.
In this post we look at the SPDR Gold Shares fund NYSEARCA: GLD in the context of price action since the 2011 high.
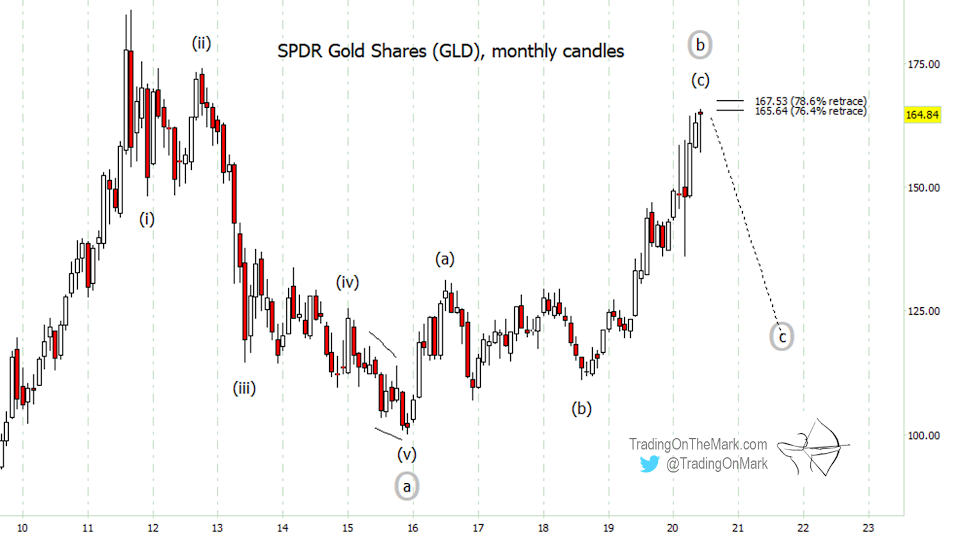
On the scale of a monthly chart, price has reached the “three-quarters retracement” area of the 2011-2015 decline. Resistance at the 76.4% and 78.6% Fibonacci retracement levels lurks here at 165.64 and 167.53.
The area is particularly likely to act as resistance because the climb up from the low appears to have been corrective. dddddddddIn fact our main Elliott wave count treats the rise from 2015 as a B-wave, meaning it should be followed by a strong downward C-wave.
SPDR Gold Shares (GLD) “monthly” Chart
We find more details on a weekly chart, as well as daily and intraday charts (not shown here), that support the idea of a nearly finished upward pattern. After sub-waves (a) and (b) of circle-b, we would expect sub-wave (c) to take the form of a five-wave rally from the 2018 low.
On faster charts it’s possible to count the progress of sub-sub-wave ‘v’ of (c), which has already moved through what are probably the first four of its tiny internal swings.
SPDR Gold Shares (GLD) “weekly” Chart
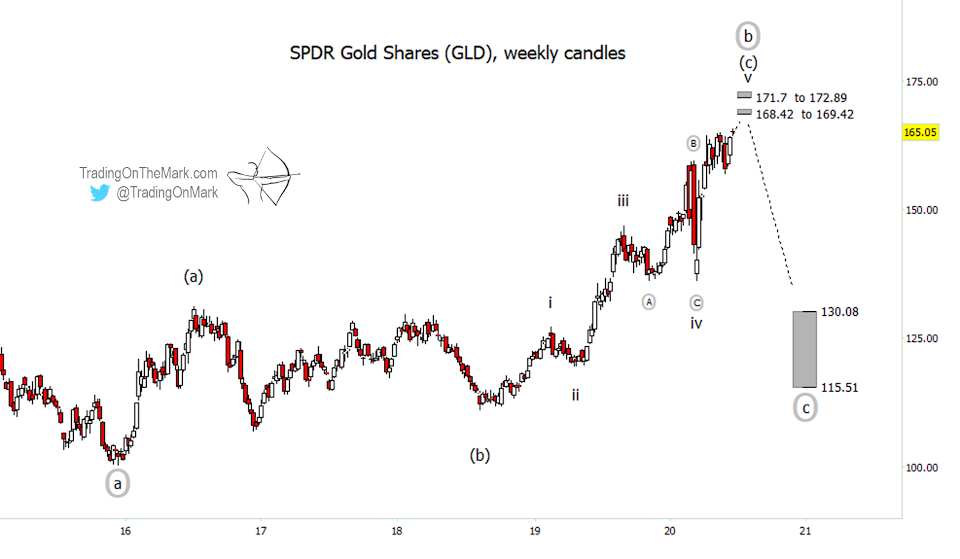
Some resistance areas to watch on a weekly or daily time frame include the area from 168.42 to 169.42 as well as the area from 171.70 to 172.89. Those are based on Fibonacci relationships of wave ‘v’ to the previous waves ‘i’ and ‘iii’, and they also consider ratios internal to wave ‘v’.
If a reversal takes place nearby, then gold bears might think of a very rough target area between 130.08 and 115.51. That’s based on an expectation of a 50% or 61.8% Fibonacci relationship of the circle-c and circle-a waves. We will be able to refine the target as the decline progresses.
Visit our website for more charts, and follow Trading On The Mark for updates and special offers.
Twitter: @TradingOnMark
The authors may have a position in the mentioned securities at the time of publication. Any opinions expressed herein are solely those of the author, and do not in any way represent the views or opinions of any other person or entity.


