Since the global synchronized economic rebound that got underway in the middle of last year, one key standout and something I’ve been bullish on is the rebound in global trade growth.
Today I want to highlight a couple of charts that put this into context, both looking at global trade volume trends.
As a reminder, I remain optimistic on the global economy on the basis of solid manufacturing activity, improving global trade growth, rising property prices in the major economies, and still supportive monetary policy. Along with the fact that commodity prices have been stable and most financial assets have seen rising prices, confidence is generally much improved too, which paints a picture of at least ongoing growth and decent pace of growth too.
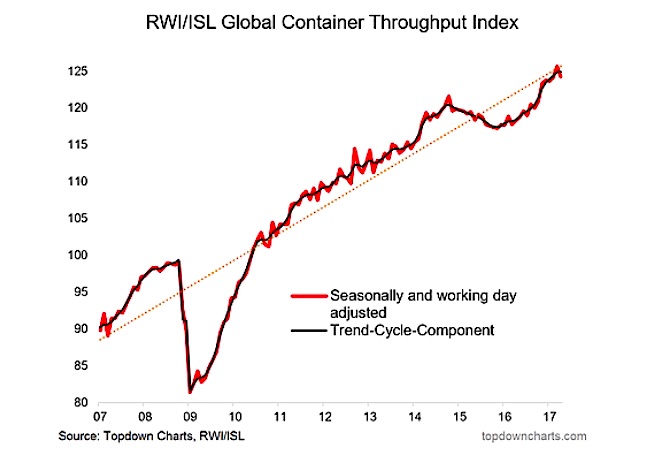
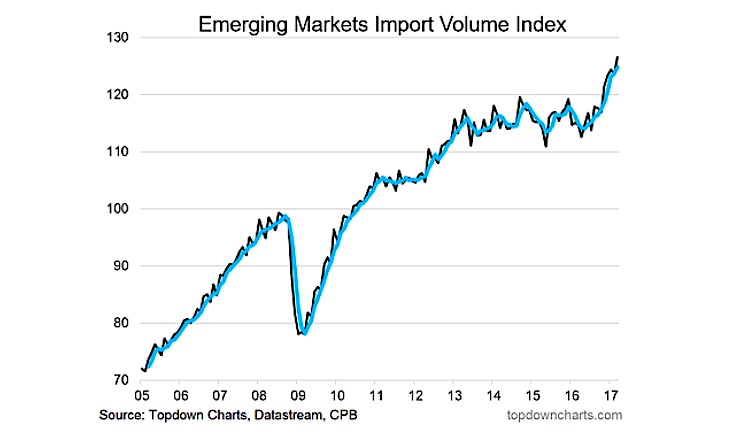
On the global trade front it’s mostly volumes I’m concerned with, and the charts below show how global container throughput volumes have moved back to trend after the 2015 slowdown. Similarly the CPB stats show emerging market import volumes breaking-out after spending years going sideways. Protectionism concerns aside, what’s happening right now is that global trade activity is solid and that’s going to be something that will help underpin my relatively optimistic outlook on the global economy.
The RWI/ISL Global Container Throughput Index has recovered back to trend after going through a slowdown in 2015/16 and shows healthy global trade activity.
Emerging market import volumes have broken out (driven mostly by Emerging Asia, and LatAm).
Thanks for reading.
Catch more of Callum’s insights on his blog, Top Down Charts.
Twitter: @Callum_Thomas
Any opinions expressed herein are solely those of the author, and do not in any way represent the views or opinions of any other person or entity.


