The month of May continued to see stock market growth, with a backdrop of increasing political turmoil in the U.S. And the drum beat has carried the tune into June… with the S&P 500 (INDEXSP:.INX) near all-time highs.
It appears less likely that a distracted President Trump will bring tax reform anytime soon, nonetheless the current drumbeat in the market is economic recovery, low unemployment, and a Federal Reserve poised for growth.
And most seem to be marching along.
Stocks & Bonds
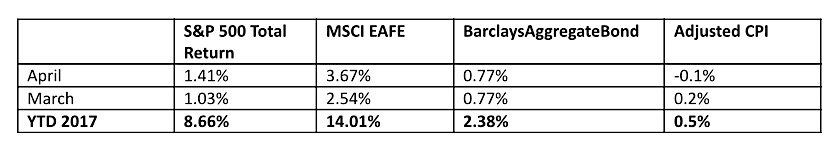
The U.S. stock market continued its upward trajectory in May. The Fed continues to focus on the low unemployment rate as evidence of a firm recovery, and market participants are apparently starting to believe. The European stock market is continuing to outperform the U.S. year-to-date, after several years of under-performance. Here are the numbers:
Commodities & Currencies
Crude Oil prices continued to lose ground in May, and for the year are now down over 10%. Promised crude oil (NYSEARCA:OIL) production cuts from OPEC have disappointed in real life, and inventories remain stuck near historic highs, keeping pressure on prices. Gold (NYSEARCA:GLD) drifted higher slightly, and is up just over 10% for the year.
The U.S. dollar (CURRENCY:USD) lost over 2% for the month, and is now down over 5% year-to-date. The currency market is apparently more bearish on the U.S. economic recovery than the stock market.
Economy
The ISM Manufacturing PMI in May came in at 54.9%, a reading nearly identical to April. This indicates continued expansion, although somewhat softer than the growth of the first quarter. The non-manufacturing, or services, index came in at 56.9%, down slightly from April’s reading, but still solidly in expansion territory. The Commerce Department released its second estimate of first quarter growth, updating the partly first estimate of 0.7% growth to a still-meager 1.2%. According to the Bureau of Labor & Statistics, the unemployment rate hit another multi-year low of 4.3% last month. At the same time, the labor force participation rate remains stuck near a historic low of 62.7%.
The National Association of Realtors reports that existing-home sales in April 2017 were 1.6% higher than in April 2016. In addition, the median price increased 6.0% to $244,800. Median home prices have now been rising for the past 62 months. Distressed sales (foreclosures and short-sales) were just 5% of total sales in April, down from 7% a year ago.
Commentary
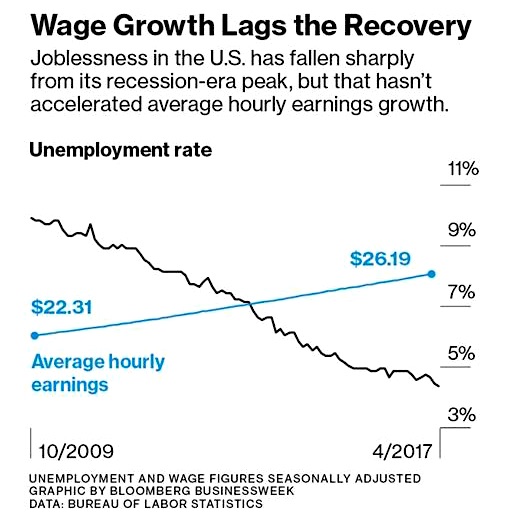
One of the biggest mysteries, and perhaps the biggest complaint about, the current economic recovery is the lack of wage growth. Official unemployment has fallen from near 10% at the height of the 2008-2009 crisis to near a historic low of 4%. This plummeting unemployment rate has historically been matched with soaring wage gains as employers fall over each other to compete for workers. That has not happened – and the wage gains that have accrued (at less than 2% annually since 2009) have largely been consumed by rising health care costs and higher income and payroll taxes:
This is a problem. President Trump is currently talking about repealing parts of Dodd-Frank, which could theoretically provide more access to credit for American consumers. However, without growing incomes, there is ultimately a cap on the amount of debt that the consumer can bear. With housing prices higher than they have ever been prior to the crisis, the relevant question is whether or not the expansion can continue.
Even if wage growth is weak, it still counts as growth, and by most measures the real economy certainly looks healthy. But that does not mean the financial markets are also healthy. The two are inextricably linked, but the real economy is the responsible, steady sibling, while the financial markets are certainly the more emotional and irresponsible of the two. For example, in 2008 the S&P 500 fell 37.17%. That same year GDP, the real economy, declined by only 0.3%. The following year GDP declined a further 2.8%, while the S&P 500 came roaring back and gained 26.46%.
The questions in the financial markets are whether or not the consumer can keep borrowing, whether or not tax stimulus is coming, and whether or not there might be a new financial shock from outside the U.S. Disappointing answers to any of those questions might only cause GDP to dip slightly into negative territory, but that could still mean painful days for the financial markets.
These remain challenging days for investors – stocks are at all-time highs, and sometimes the path of least resistance is upwards. We remain long-term bullish, but also diversified to weather out the next rainy day, whenever that might be.
This material was prepared by Greg Naylor, and all views within are expressly his. This information should not be construed as investment, tax or legal advice and may not be relied upon for the purpose of avoiding any Federal tax liability. This is not a solicitation or recommendation to purchase or sell any investment or insurance product or service, and should not be relied upon as such. The S&P500, MSCI EAFE and Barclays Aggregate Bond Index are indexes. It is not possible to invest directly in an index. The information is based on sources believed to be reliable, but its accuracy is not guaranteed.
Investing involves risks and investors may incur a profit or a loss. Past performance is not an indication of future results. There is no guarantee that a diversified portfolio will outperform a non-diversified portfolio in any given market environment. No investment strategy can guarantee a profit or protect against loss in periods of declining values. Listed entities are not affiliated.
Data Sources:
www.standardandpoors.com – S&P 500 information
www.msci.com – MSCI EAFE information
www.barcap.com – Barclays Aggregate Bond information
www.bloomberg.com – U.S. Dollar & commodities performance
www.realtor.org – Housing market data
www.bea.gov – GDP numbers
www.bls.gov – CPI and unemployment numbers
www.commerce.gov – Consumer spending data
www.napm.org – PMI numbers
www.bigcharts.com – NYMEX crude prices, gold and other commodities
https://www.bloomberg.com/news/articles/2017-05-19/unemployment-in-the-u-s-is-falling-so-why-isn-t-pay-rising – graphic illustrating wage growth and the unemployment rate
Any opinions expressed herein are solely those of the author, and do not in any way represent the views or opinions of any other person or entity.

 Trading Near Top Of Price Range")


