November was a quiet, albeit thematic month in the global markets as Mario Draghi continued to move the Eurozone towards more easing, and in the U.S. the Federal Reserve continued to move towards tightening.
The commodities selloff continued to rattle the global markets, as investors try to piece together the puzzle.
So far, the domestic recovery has not been overly affected by slowing economies around the world, as employment and GDP numbers are still positive, albeit marginally.
Stocks & Bonds
The S&P 500 traded sideways in November, as traders saw both good and bad in the upcoming Federal Reserve rate hike. On one hand, the Fed is raising rates probably because of a firming U.S. economy. On the other hand, rising rates and a strengthening U.S. Dollar are likely negative for commodities and other risk assets across the global markets.
Of note, the Yuan earned inclusion in the IMF SDR basket, a largely symbolic move which has not yet slowed capital outflows from China.
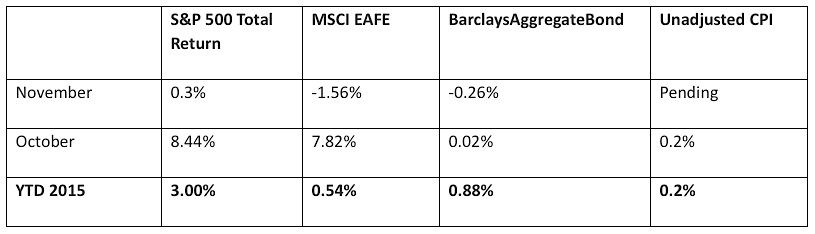
By the numbers:
Commodities & Currencies
NYMEX crude oil sold off about 12 percent in November, and is down over 30 percent year-to-date. Many oil market commentators are talking about a ‘lower for longer’ period where crude oil prices stay low for at least a few years, rather than rebounding quickly as they did in 2009.
This is due to the inherent difference between these two selloffs – in 2009, a financial meltdown in the global markets led to asset prices falling everywhere, although underlying oil demand was strong and supplies were merely sufficient to meet good demand.
Today, there is no leading financial crisis, and the oil market is generously over supplied as global demand is quite weak. Until more oil producers go bankrupt, or global demand spikes upward, oil prices look indeed to be ‘lower for longer.’
The U.S. Dollar Index rose over 3 percent in November, and for the year is up about 8.5%. This relative strength is starting to impact exports and corporate profits, and could increase further when the Fed raises rates. The strengthening U.S. Dollar is also part of the story behind weak crude oil prices.
Gold fell another 6 percent in November and is down over 10 percent year-to-date. As rates rise, assets generally move away from gold, which generates no interest or dividend, and towards interest-bearing investments.
Economy
The ISM Manufacturing PMI in November came in at 48.6, finally moving into contraction territory after several months of slowing growth. This was the first time the reading has been below 50 in 3 years. The sub-index of exports remained at a weak 47.5. As manufacturers face headwinds, the economy is increasingly reliant on the U.S. consumer. The unemployment rate was unchanged in November, staying at 5.0%, although the underemployment rate rose to 9.9% from 9.8%, and labor force participation crept up slightly from 62.4% to 62.5%, still near its decades-low mark.
Summary
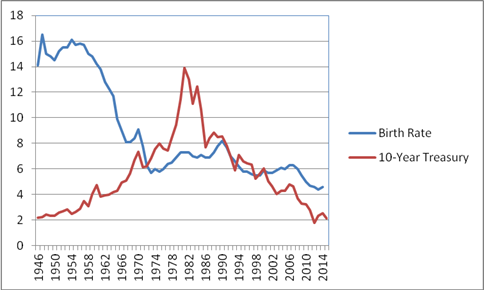
Here is a chart that does not make any sense. I compared the United States birth rate (less mortality so that the birth rate is ‘net’ rather than ‘gross’) and compared it to market interest rates as measured by the 10-Year US Treasury note. Starting in 1946, the first year of the baby boom generation, there does not seem to be any relationship between the two.
However, what happens when those baby boomer babies enter their 20s and 30s and start borrowing money for school, or a home, or a new business? I ‘lagged’ the birth rate data by 28 years, and this is what the relationship between the baby boomers and United States interest rates looks like:
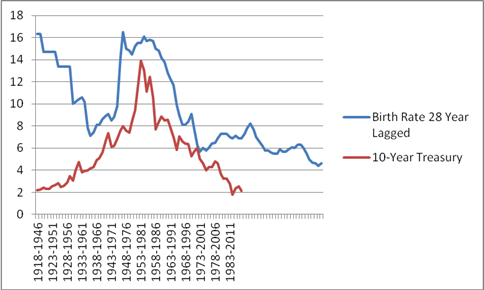
This chart seems to be clear – more babies means higher interest rates, and fewer babies means lower interest rates. Keep in mind that the birth rate is a relative number – there are more babies being born today than in 1946, but relative to the size of the population and economy the newcomers are a much smaller force.
Although there is more to the interest-rate story than just demographics, they are a powerful force that is too often forgotten in today’s conversation about interest rates. The ‘pig in the python’ of baby boomers is retiring – rather than borrowing and driving up interest rates, they are retiring and paying down debt, driving down interest rates.
Regardless of whether the Federal Reserve changes its guidance by a pittance, I believe low interest rates are here to stay for at least another 15 years, barring any monumental government spending increase. ‘Low’ still leaves plenty of room for volatility from month-to-month and year-to-year, so any investor needs to be patient and take a long view. But studies in Japan have shown that their ultra-low interest rates are strongly tied to their aging population.
It is a fool’s errand to predict where any market is headed in the short-term, but with an aging population and a shrinking birth rate, there does not seem to be any near-term, or even medium-term, pressure on interest rates. The Federal Reserve might raise guidance by 0.25% in a week or two, but as the price of commodities collapses around the world, it is just as likely that their next move will be back to 0% as it is to 0.5%. Especially with data showing slow growth around the global markets.
I continue to take a contrarian approach with bonds – long duration and high quality, as opposed to the short duration advised by most financial professionals.
Thanks for reading.
This material was prepared by Greg Naylor, and all views within are expressly his. This information should not be construed as investment, tax or legal advice and may not be relied upon for the purpose of avoiding any Federal tax liability. This is not a solicitation or recommendation to purchase or sell any investment or insurance product or service, and should not be relied upon as such. The S&P500, MSCI EAFE and Barclays Aggregate Bond Index are indexes. It is not possible to invest directly in an index. The information is based on sources believed to be reliable, but its accuracy is not guaranteed.
Investing involves risks and investors may incur a profit or a loss. Past performance is not an indication of future results. There is no guarantee that a diversified portfolio will outperform a non-diversified portfolio in any given market environment. No investment strategy can guarantee a profit or protect against loss in periods of declining values. Listed entities are not affiliated.
Data Sources:
- www.standardandpoors.com – S&P 500 information
- www.msci.com – MSCI EAFE information
- www.barcap.com – Barclays Aggregate Bond information
- www.bloomberg.com – U.S. Dollar & commodities performance
- www.realtor.org – Housing market data
- www.bea.gov – GDP numbers
- www.bls.gov – CPI and unemployment numbers
- www.commerce.gov – Consumer spending data
- www.napm.org – PMI numbers
- www.bigcharts.com – NYMEX crude prices, gold and other commodities
- https://www.bloomberg.com/news/articles/2014-07-27/china-hides-treasury-buys-in-belgium-chart-of-the-day – Article referencing Euroclear Bank SA
Any opinions expressed herein are solely those of the author, and do not in any way represent the views or opinions of any other person or entity.


