 If there is one thing I’ve learned over the years, it’s that good investors always know what’s happening throughout the global markets. Whether it’s the German DAX, the Japanese Yen, or the price of Crude Oil, investors are better served if they know and understand how and where capital is flowing. Inter-market relationships (analysis) often help to piece together the macro puzzle.
With that said, I don’t have the time today to delve into all facets effecting global markets, but I would like to take a quick trip around the globe, looking specifically at equity indices for some key countries.
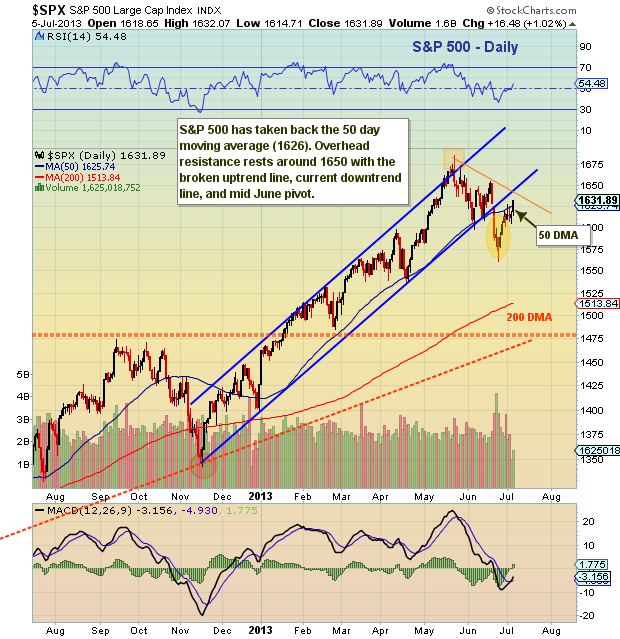
First, let’s start with the U.S. and the S&P 500. Note that I just posted an article on US Equities. In short ,1640-1650 appears to be a key toggle to watch.
 Similar to US Equities, the European markets have held up pretty well, bouncing and treading water of late. As so often is the case, follow through will be key. On the other end of the spectrum, the London FTSE and French CAC40 have felt a bit more pain, experiencing a deeper correction than the DAX (and most global markets). Recent bounces have mitigated some of that pain, but they’re not out of the woods just yet.
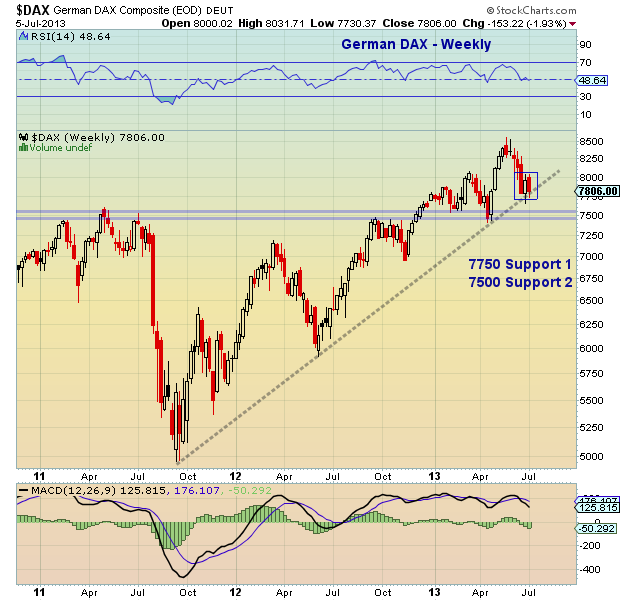
The German DAX is holding just above its uptrend line, a key level to watch. Below that comes the 7500 area.
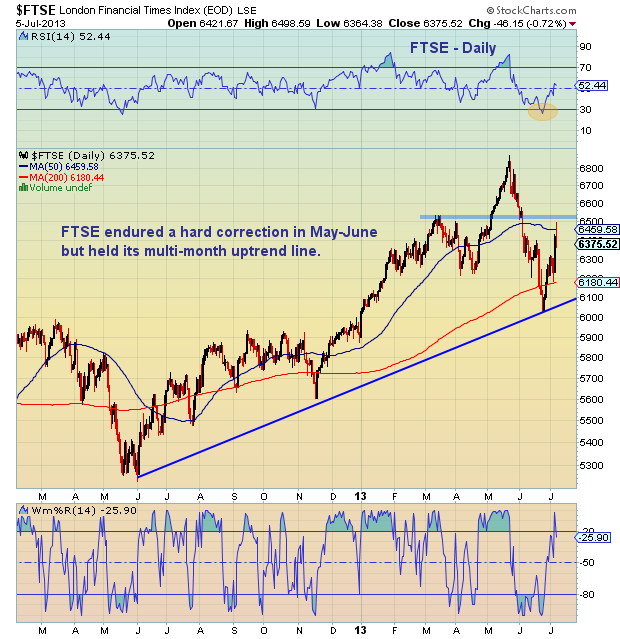
 The London markets (FTSE) felt a steeper correction than most, falling nearly 14% during May-June. However, the index still managed to hold it multi-month uptrend line. Overhead resistance sits overhead with the 50 day moving average and lateral congestion.
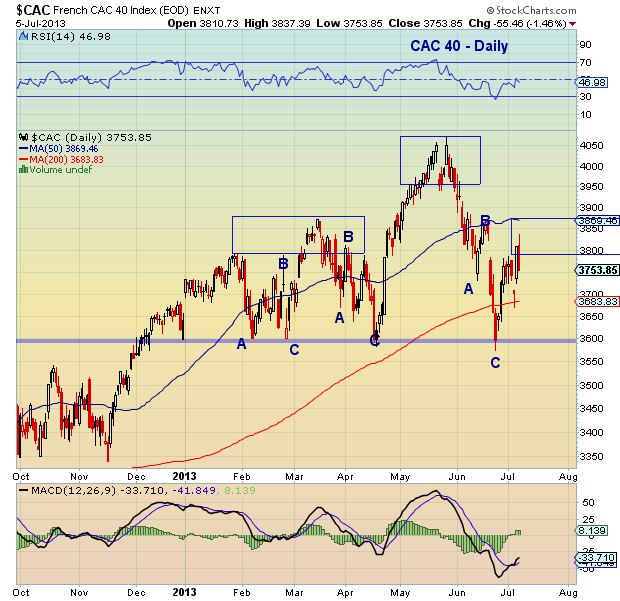
 The French CAC40 has rebounded into lateral resistance as well. If the rally doesn’t see follow through it could run the risk of forming a right shoulder on a head and shoulders pattern. As well, the index is heavy on A-B-C measured moves. Could it be forming another one to the upside (an A-B-C pattern into the 50 day moving average)?
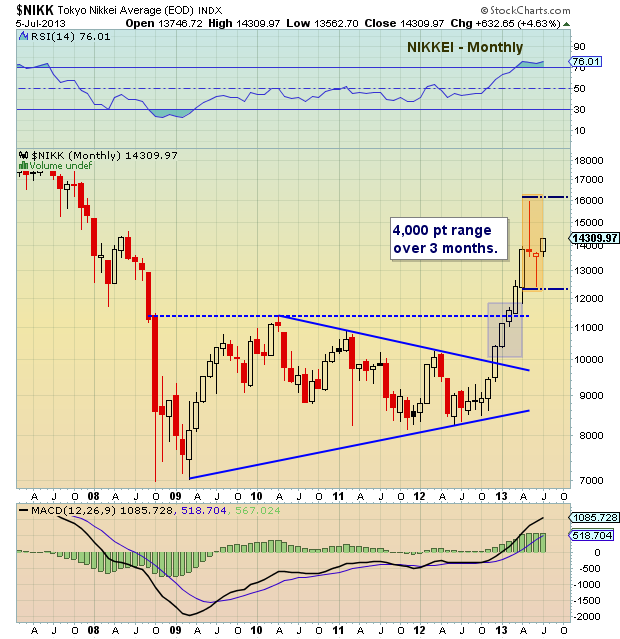
 Heading further east as we span the global markets, the Japanese Nikkei has found both resurgence and volatility with its new Abenomics approach (In Abe We Trust!). The Japanese stock market rocketed higher before crashing almost 4,000 points in a matter of days. For better or worse, this has the Nikkei in the spotlight of global markets. Currently, the index is trying to consolidate its move higher within the very wide range (roughly 4,000 points). Continued volatility will likely test investors patience, but it is a necessary evil if the index is going to consolidate its gains. Note the chart below is a monthly chart.
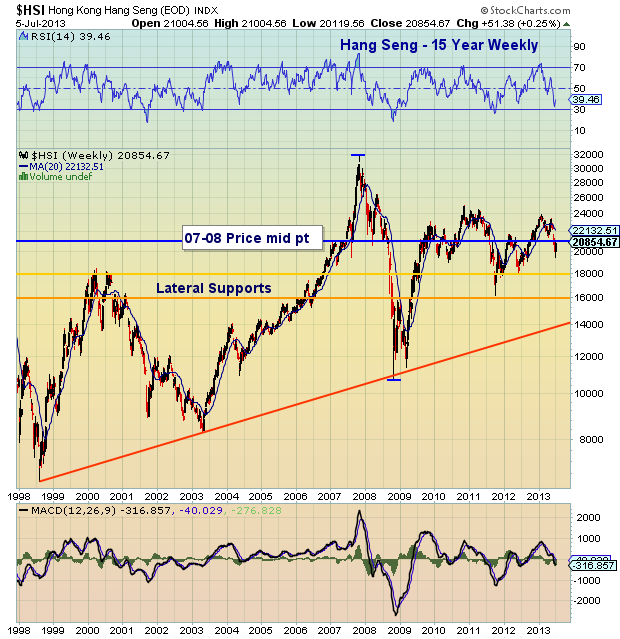
A glimpse at China through the Hang Seng index highlights a market searching for direction. The chart below is a 15 year weekly chart and it’s clear that investors are still seeing reverberations from the 2007-2008 global markets swoon (and Hang Seng swoon). A move above 24000 would be bullish, while a move below the recent lows would usher in caution.
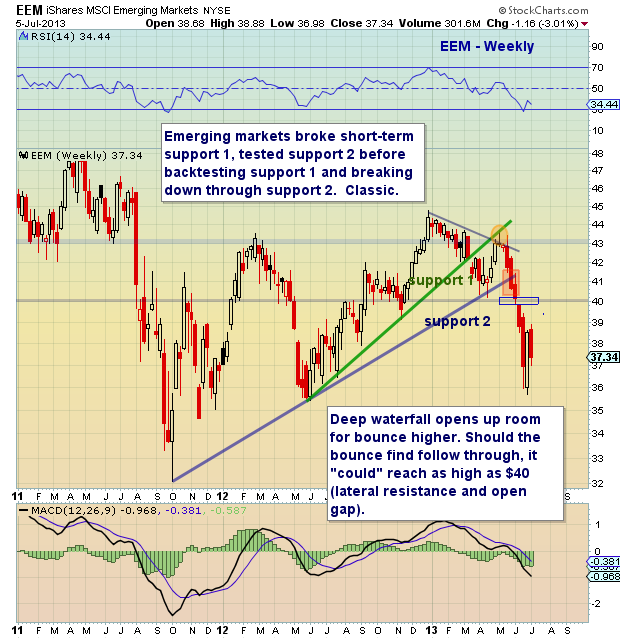
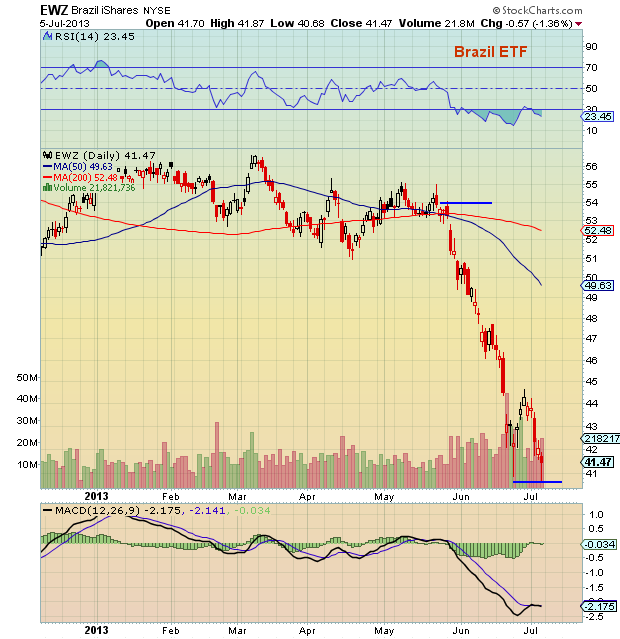
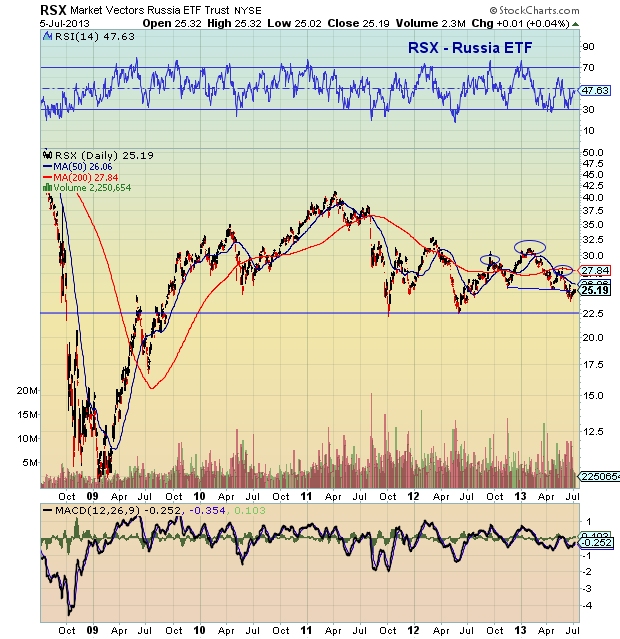
 The recent corrections in the aforementioned global markets don’t come close to the beating that the Emerging Markets (EEM) have taken. EEM is down roughly 15 percent in the past two months (see weekly chart below); the Russia Index (RSX) is tracking in stride, while the Brazil Index (EWZ) has dropped nearly 22 percent (see daily charts below). Note the potential head and shoulders pattern on the Russian index; although the resurgence of crude oil may support the index.
 Brazil ETF (EWZ)
Russia ETF (RSX)
Short and to the point. Thanks for reading this global markets recap. Trade safe, trade disciplined.
Twitter: @andrewnyquist and @seeitmarket
No position in any of the mentioned securities at the time of publication.


