 Whenever I dig into US equities, my main go-to indices are the S&P 500 and the Russell 2000. The S&P 500 offers a balanced look at large caps, while the Russell 2000 provides insight into the small caps and high beta side of the marketplace. So in that vein, I’ll keep this simple and hone in on these two areas of the market to offer insight into key technical levels and overall health of US equities.
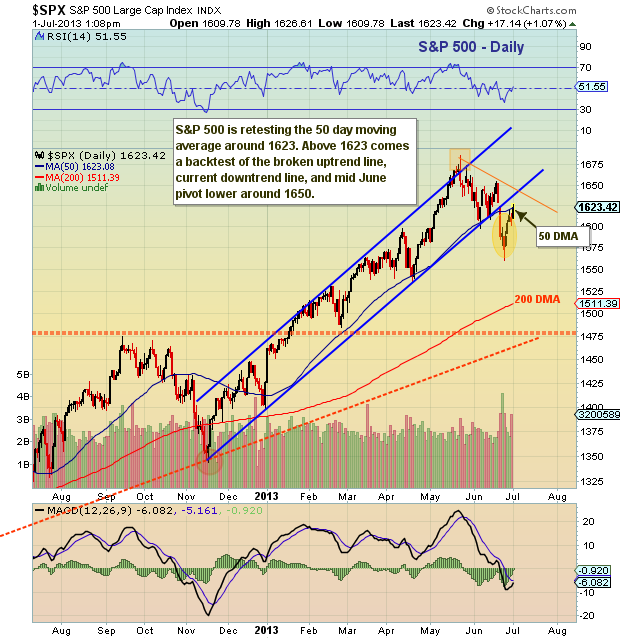
Looking at the S&P 500 channel chart below, the first thing that stands out is that the channel as we knew it is broken. And it was this breakdown that lead to another 60 point drop. All told, the pullback from the May high has amassed a 7.5% drop (top to bottom). The subsequent rebound has been sharp (+4%) and has the index testing the underside of the 50 day moving average (1623).
S&P 500 Technical Chart – US Equities
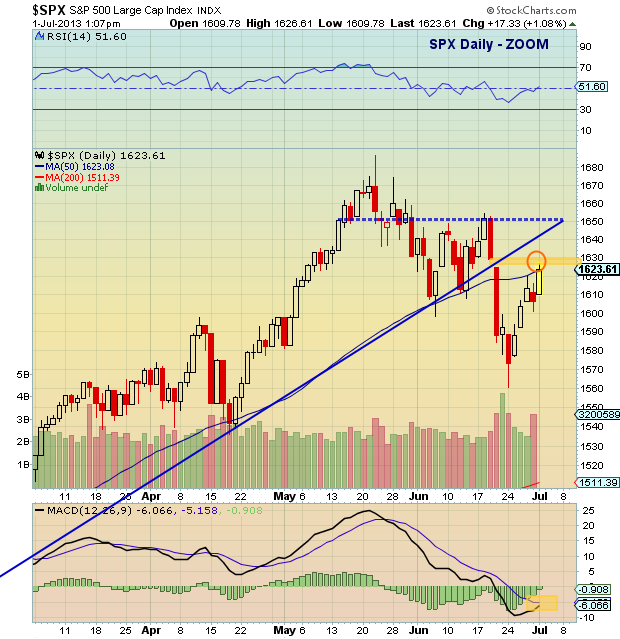
 If the index can power through the 1623 level, the next resistance level would come into play around 1645-1650. In the S&P 500 “ZOOM” chart below, the 1645-1650 level represents a backtest of the broken trend line (lower channel), as well as a retest of the mid-June sharp pivot lower (1654 to be exact). Currently, this is simply classified as backtest resistance levels, however, a sustained break above 1650 would likely bring new highs for US equities and 1700+.
S&P 500 ZOOM Chart – US Equities
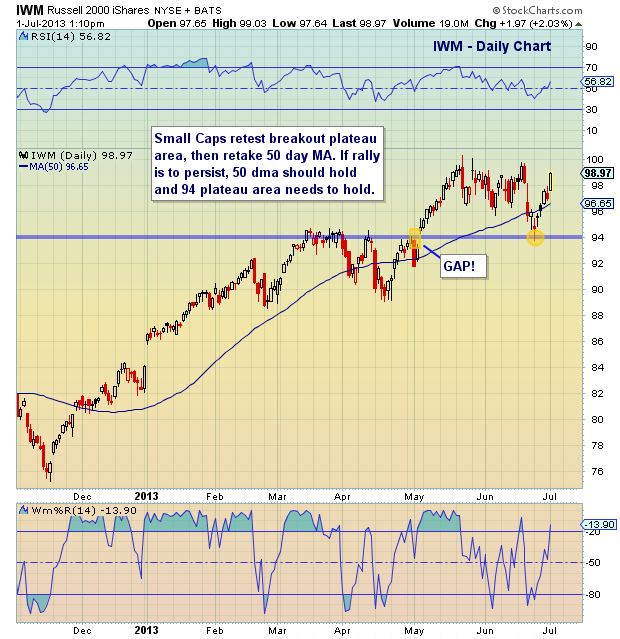
So let’s turn to the Small Caps (see chart below) because they clearly have a role to play here. The Russell 2000 (by way of IWM) has burst back with a vengeance (as only our high beta brothers can), and appears to be climbing towards a retest. This retest would likely coincide with S&P 500 1650ish and it is at this point that the market would likely pause for digestion before making an all apparent move higher or lower. So it is with this in mind that I believe the key levels to watch on US Equities are S&P 500 1650ish and new highs on the Russell 2000.
Trade safe, trade disciplined.
Twitter: @andrewnyquist and @seeitmarket
No position in any of the mentioned securities at the time of publication.
: Creating Bullish Divergence?")


 and Semiconductors (SMH): Concerning Price Pattern?")


