Though many investors may not be ready to put fresh money to work in the equities market, it is always a good idea to run relative strength screens of domestic, international, and emerging markets stocks.
This allows portfolio managers to know what is being favored… and what is likely to outperform going forward.
The best way to do this is with ratio analysis.
Below I use ratio charts to highlight relative strength. As you can see below, international and emerging markets could be setting up for a potential relative strength switch.
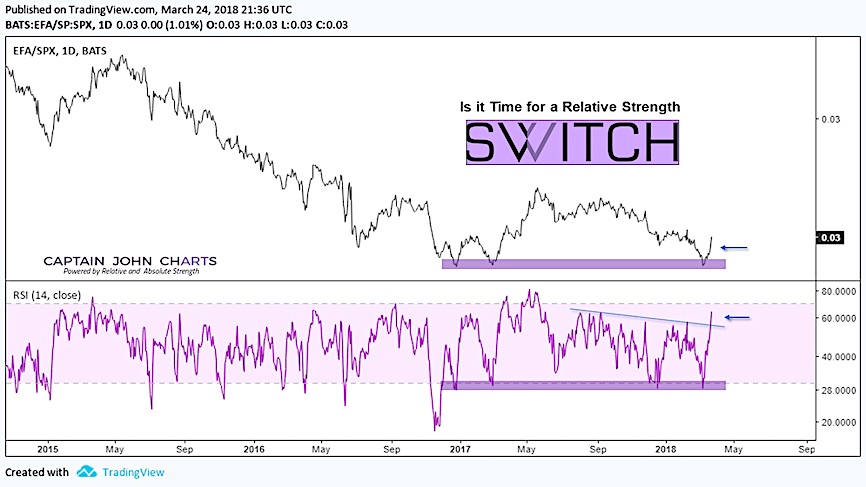
iShares MSCI EAFE (EFA) vs the S&P 500 (SPX)
This ratio looks to be making a triple bottom which would favor a switch into developed international equities (as represented by EAF). Momentum is also supporting this idea.
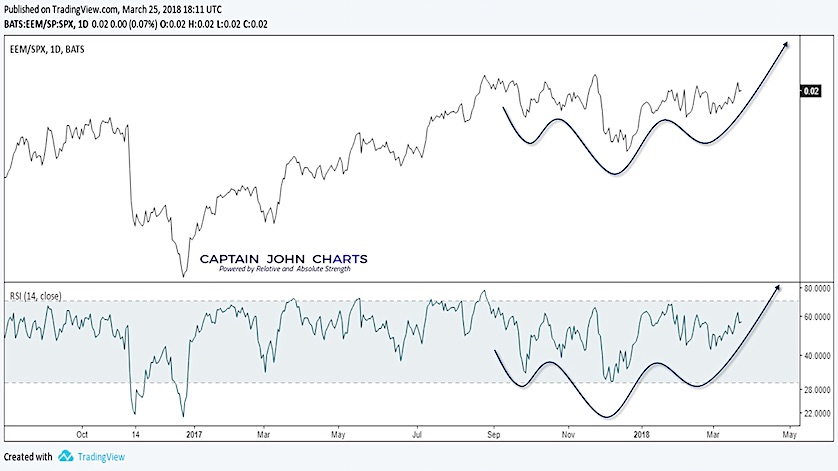
iShares Emerging Markets (EEM) vs the S&P 500 (SPX)
This ratio is working on a bullish inverse Head & Shoulders continuation pattern confirming the out-performance of emerging markets equities. Momentum is making it’s own bullish inverse H&S pattern.
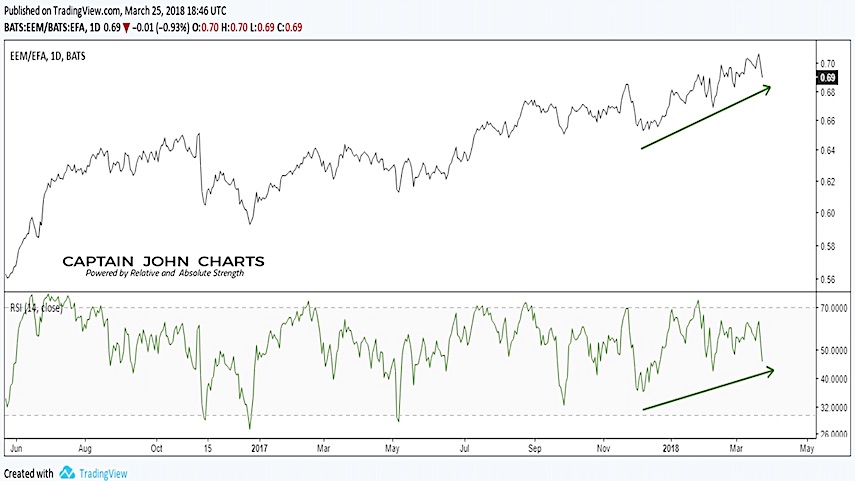
iShares Emerging Markets (EEM) vs iShares MSCI EAFE (EFA)
This Ratio continues to outperform placing EEM and emerging markets equities in first place!
Inverse ETFs can be used to hedge long positions and/or for those that wish to set up a pairs trade.
If you are interested in learning more about our investing approach and financial services, visit us at CaptainJohnCharts.
Twitter: @CptJohnCharts & @FortunaEquitis
The author may have a position in mentioned securities at the time of publication. Any opinions expressed herein are solely those of the author, and do not in any way represent the views or opinions of any other person or entity.


