Earlier this week, our management team trimmed Canadian equities exposure across client accounts from a slight overweight, to market weight.
To put this change into context for those outside our service, we had added to Canadian equities positions at the end of February this year during the global equities market correction.
At that time our market indicators continued to signal the current bull market was not at risk of rolling over to the full-on bear market, thus giving us conviction the market drop was more of a correction / buying opportunity.
In the following analysis, we will share our rationale behind removing this overweight.
Market Cycle – still bullish but with less conviction
When we refer to the market cycle, we are incorporating not just the equity markets but the economy as well. This is an important differentiation.
Historically, every recession in the global economy roughly coincides with a bear market in equities. However, there are some bear markets in equities that do not coincide with a significant drop in global economic activity. An example of the latter was in 2011 when the S&P 500 and TSX experienced declines in excess of 20% while U.S., Canadian and global economic activity continued to rise. Another example happened in 1987 when the S&P 500 dropped 28% over four trading sessions, yet the U.S. economy grew that year. The same occurred again in 1998. Charts are sourced to Bloomberg unless otherwise noted.
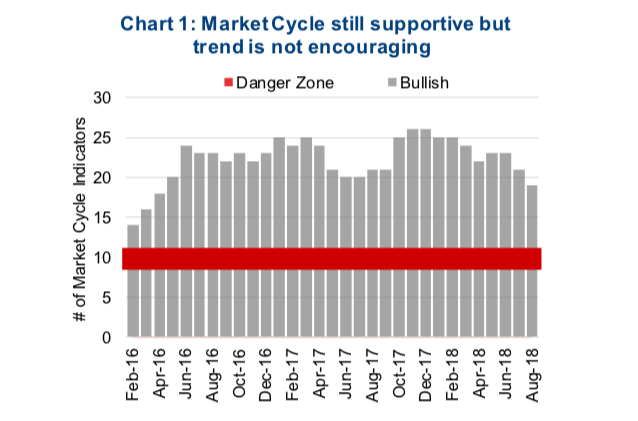
Given this framework, the current market cycle entered the bullish phase in March of 2009 and is now in its tenth year. This makes the current bullish cycle the second longest, based on our framework that goes back to 1950. Old yes, but the majority of our Market Cycle Indicators remain supportive with 19 of 30 remain bullish. This is well above the threshold of 10 / 30 that would have us believe the end of the current cycle is imminent. However, the trend of positive indicators has been falling steadily in 2018, and this contributed to our desire to reduce equity exposure, at least scale it back to a more neutral weighting.
Among the signals that prompted our decision is the yield environment that is not positive. This is primarily due to the U.S. Federal Reserve raising short-term interest rates. While still historically low, the change is what matters for markets much more than absolute levels. This has also contributed to a flattening of the yield curve. Beyond yields, global market signals have been roughly half negative and half positive.
However, market momentum and fundamentals remain positive across the board. The most recent changes have been a few of the U.S. economic indicators, which were all positive a few months ago, we have since seen a few turn negative. These include: consumer sentiment, auto sales and housing starts.
In aggregate, the Market Cycle Framework remains constructive for equities, but the trend is not overly encouraging at this time. This could change or become worse, but only time will tell. However, we decided it was best to take one step in becoming a bit more conservative at this point in time.
Why Trim Canada?
Please note this move does not result in a bearish stance on Canadian equities, but more a reduction from a previous overweight, back down to a more neutral stance. We tend to bucket equities into four groups – Canadian, U.S., International Developed and Emerging Markets. So why pick on Canada to reduce equity exposure?
U.S. equities are at all-time highs and have been leading global markets this year, which does argue for taking some off the table. However, the U.S. economy is doing very well, and earnings growth in the U.S. is among the strongest globally, providing a good fundamental foundation. Plus, if trade tensions rise, the U.S. is a more closed economy which limits the negative impact. If bond yields rise due to the strong economic data, the U.S. dollar should appreciate, helping returns from a Canadian investors standpoint.
International Developed equities are nowhere near their highs, and are down 10% since January based on Europe, Australasia and Far East (EAFE) listed exchange- traded funds (ETF). This has made valuations very compelling, in part due to tariff/protectionist risk, as EAFE is more sensitive to global trade. Fundamentals are good and reducing international developed economies equities at this point appears late.
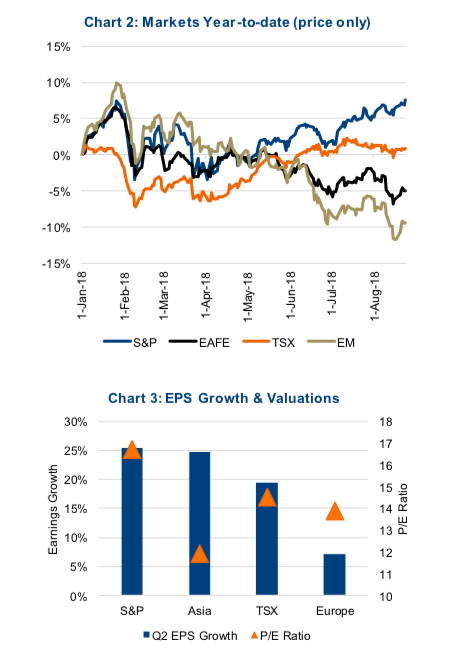
Emerging Markets (EM) are down even more than EAFE, -17% since January. Risks to global trade lands squarely on EM, and a number of more financially fragile markets are running into bigger issues. Fortunately, we have had a ‘no EM’ stance for some time. Our concerns with EM are threefold. First, a hiking Fed / higher bond yields tend to weigh heavily on EM. Second, so many years of quantitative easing in developed markets resulted in capital flowing to EM in search of yield. So much so that there is potentially a debt bubble in EM as capital may not have been allocated efficiently. And finally, it’s year 10 of a bull cycle, and we would prefer to be in EM early in recoveries, not this late in the cycle.
That leaves Canada as the top sell candidate.
Valuations in Canada are not expensive, 14.5x and the index does contain a healthy weighting in sectors that are viewed as late cyclical. However, there are risks that should temper these positives. The tariff situation remains a big wildcard. On top of this, the Canadian economy remains very levered from a debt perspective and reliant on the housing industry.
The other unfortunate characteristic for Canada is it has historically experienced a high correlation to the price performance of EM. This is in part due to the higher weighting of resource companies in the TSX, which are sensitive to economic activity in emerging economies. When global growth slows, it is often felt in EM first as their markets tend to be more sensitive and fragile. Rightly or wrongly, when this happens, global investors also move to sell resource tilted markets such as Canada and Australia.
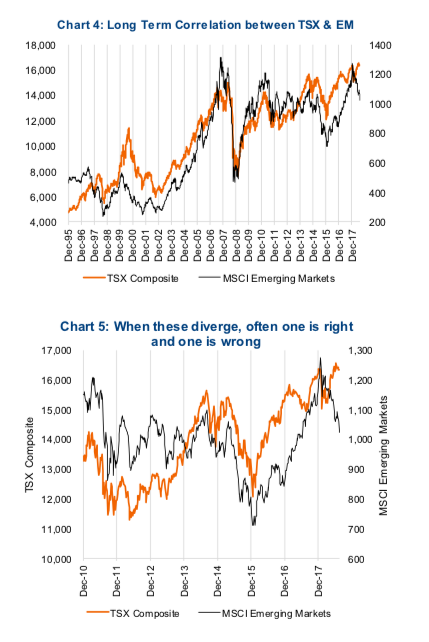
Chart 4 is a long-term chart of the TSX and EM. It clearly shows this strong directional correlation, but it is also worth noting a number of times EM started weakening before the TSX did. Perhaps this is due to EM being more fragile or sensitive to changes in investor risk appetite. Nonetheless, it may be a good early warning indicator for Canadian equities. If so, the recent drop in EM with the TSX still rising should certainly be noted by investors. (Chart 5)
Portfolio Implications – We are not saying run for the hills and dump Canadian equities, but given the gradually changing indicators and sentiment, taking some off that table may be prudent, especially if you are still overweight from your desired long-term allocation. It is common for investors to be more overweight in equities at this point in the cycle as markets have been running for so many years.
Moving back to a market weight allocation opens a number of doors. Should we see a correction in the coming months, an occurrence that is more common in August to October than other time periods, this move will help protect capital. During the correction, if the Market Cycle Indicators remain supportive, we would view this as a buying opportunity. However, if the Market Cycle Indicators continue to weaken, this move to reduce Canada will turn out to be a first step in the right direction. Now, if the market doesn’t correct and moves higher, we are still market weight and will enjoy that even more.
Twitter: @sobata416 @ConnectedWealth
Any opinions expressed herein are solely those of the authors, and do not in any way represent the views or opinions of any other person or entity.


