 Back in November, I posted about the interesting bottoming action in Gasoline prices and what that could potentially mean for a bottom in Crude Oil (CL_F), and possible Crude Oil rally. Since then, Oil has put in a bottom and rallied as high as 99.40 this past week.
Does Gasoline has more rally in the tank? Is that it for the Crude Oil rally? Well, perhaps not. There are some interesting developments that are indicating further gains could still be in the cards for both commodities. Let’s take a look at a few daily charts to highlight the setups.
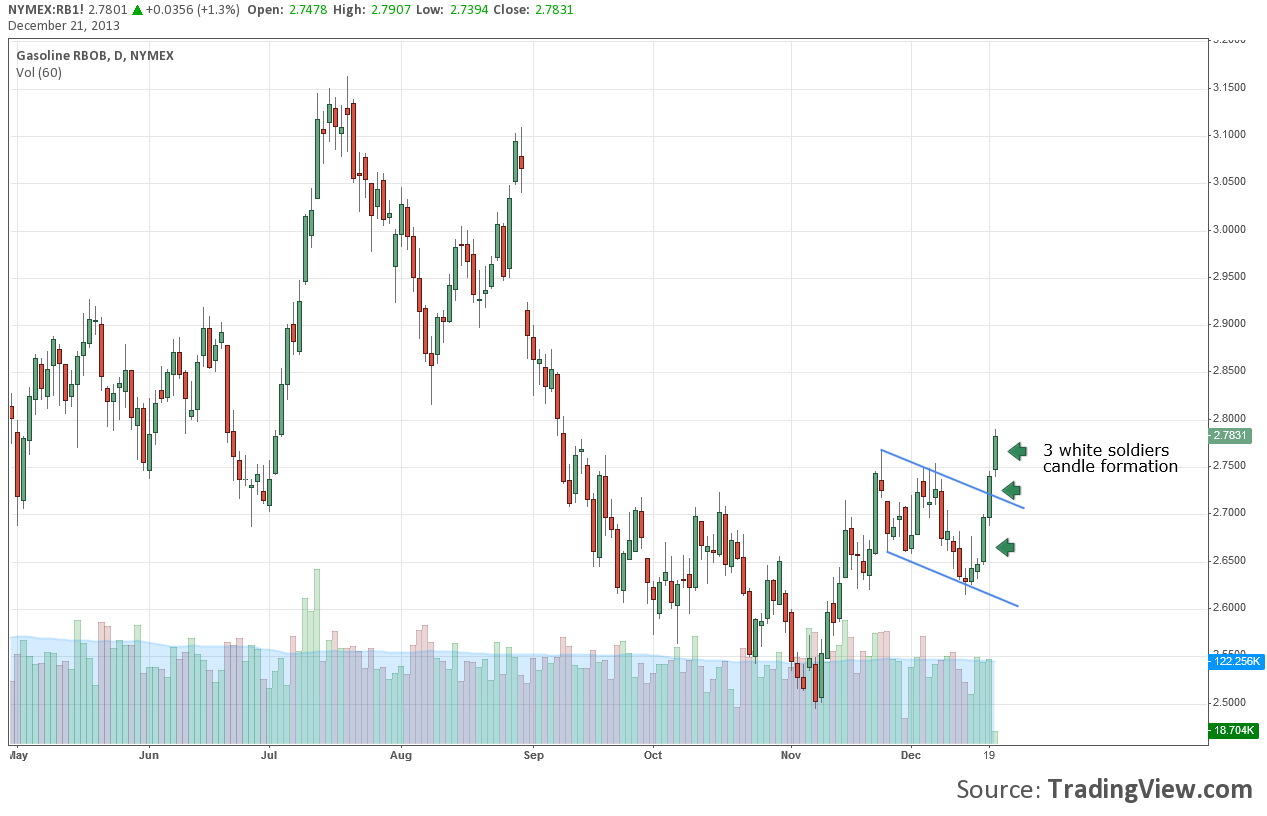
Gasoline prices traded higher this week and broke above a downward channel. They also put in a “3 white soldiers” candle formation, which is usually a bullish formation.
RBOB Gasoline Price Chart – “3 white soldiers” formation
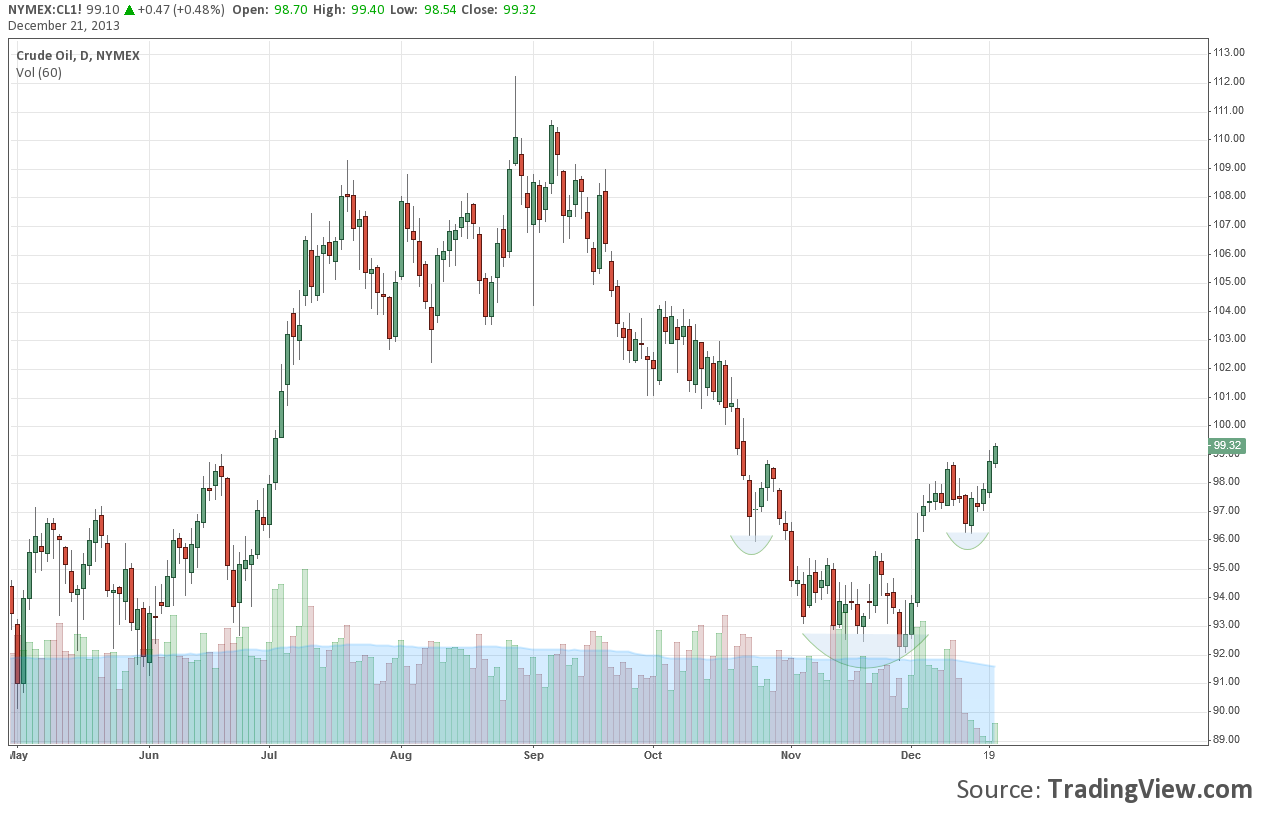
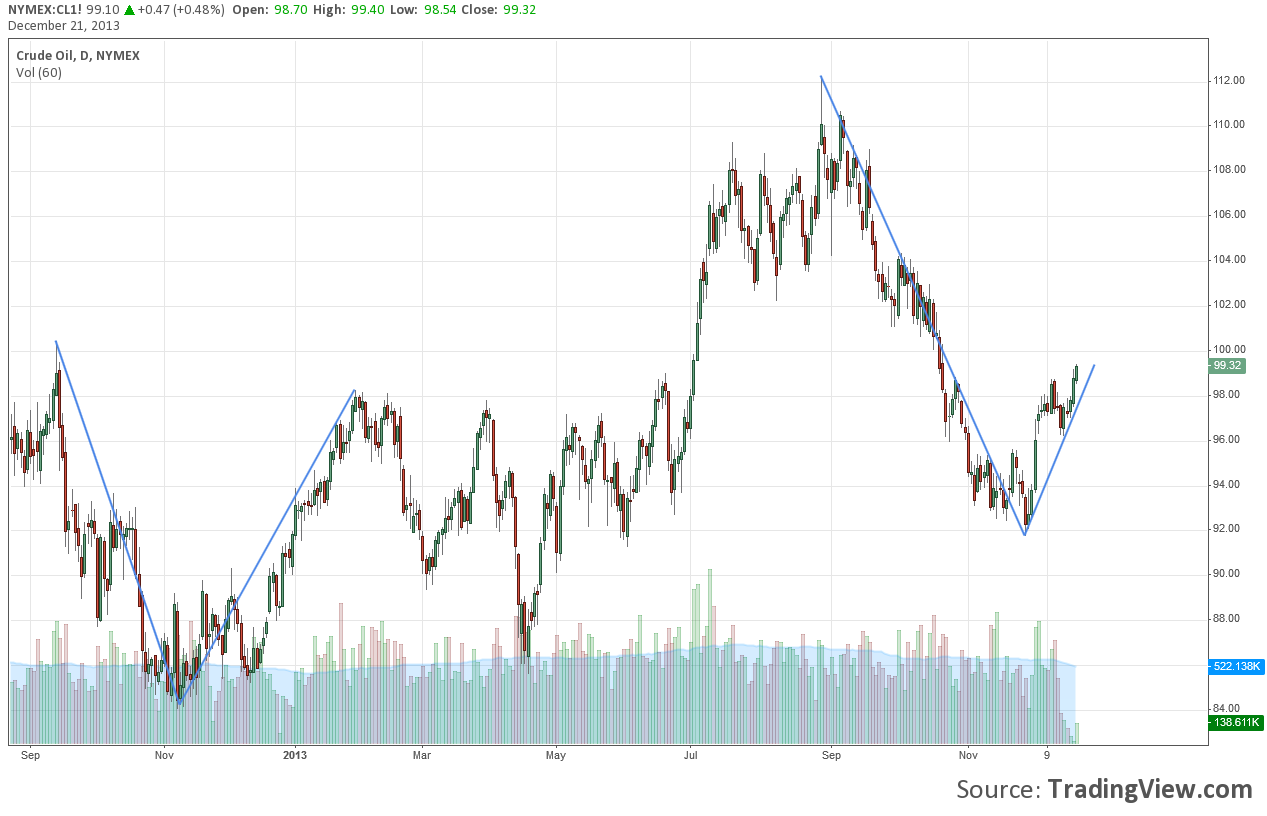
Crude Oil is working on an inverse head and shoulders formation on the daily. There could be resistance at that 100-101 level, but above that and the Crude Oil rally is on.
Crude Oil Chart – inverse head and shoulders setup
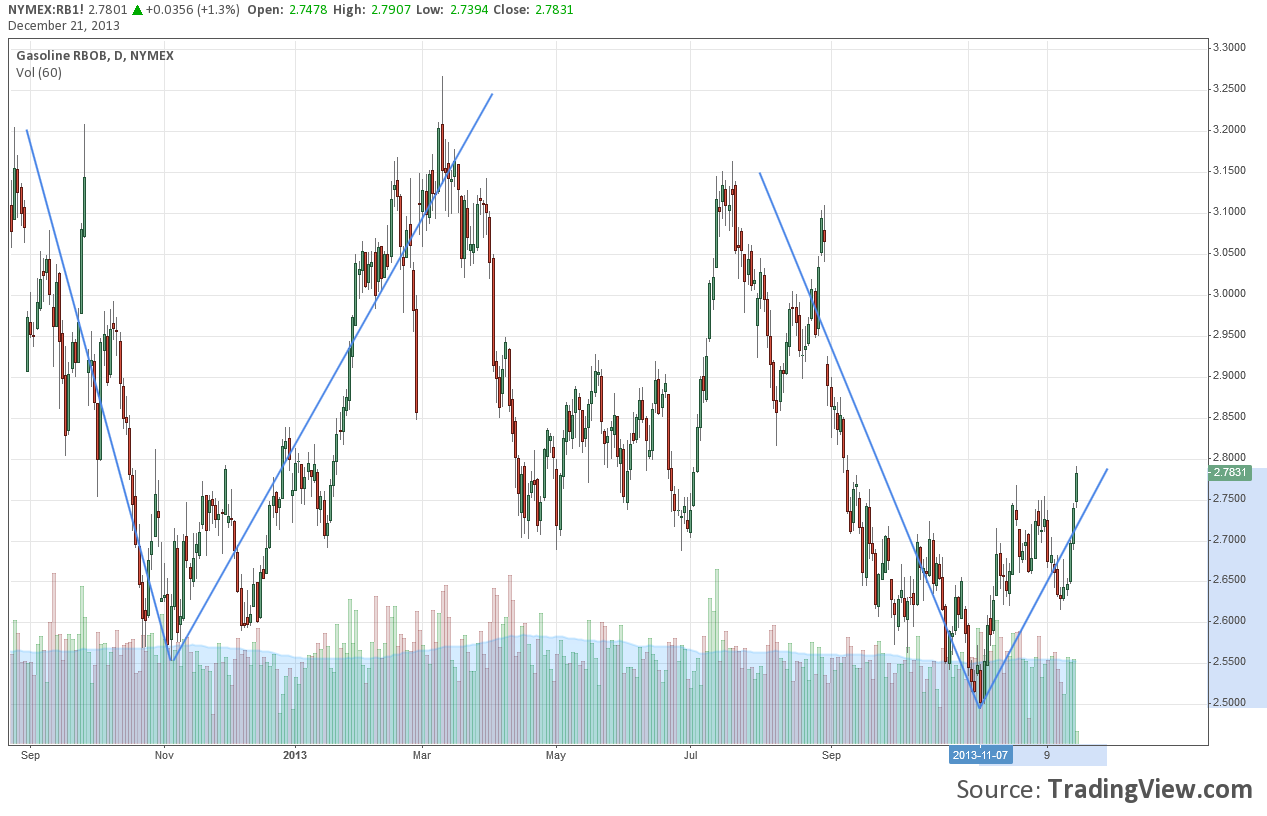
Are Crude oil and gasoline prices following the same script as last year? Time will tell, but they look very similar.
RBOB Gasoline – setup vs last year
Crude Oil Chart – setup vs last year
Thank you for reading.
Twitter: @TraderRL23
Author is long USO call spreads at the time of publication. Any opinions expressed herein are solely those of the author, and do not in any way represent the views or opinions of any other person or entity.
: Worrisome to Broader Market?")

: Important Breakout Retest")
